


For our second Makeover Monday, we were tasked with completing Makeover Monday for the USA Housing Vacancies Data from Week 11 2024. Below I’ve outlined in order what my process was, what the end result was and what could have gone better.
Exploring the data
- Total housing units, broken down by Occupied & Vacant.
- Have numbers for margin of error for total, occupied and vacant but we are only concerned with the estimates - filter the whole workbook to exclude margin of error
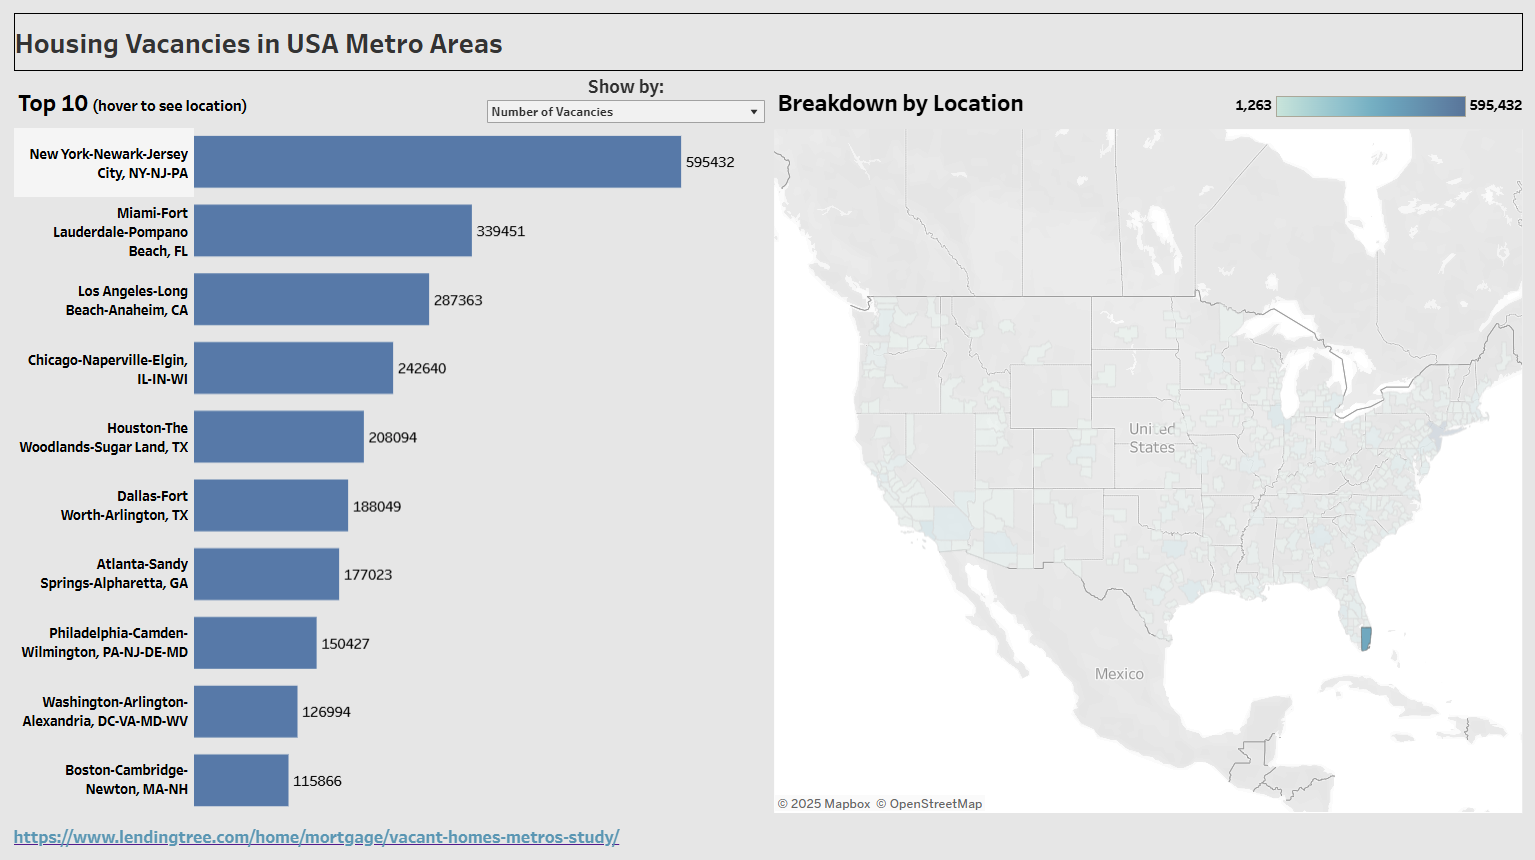
- Filter to Top 10 by Total housing units, exclude Puerto Rico regions as a worksheet filter
Method
- Create a calculated field - vacancy rate
- Create a parameter - “Show By:” “Number of Vacancies” or “Vacancy Rate” to use for my vacancy/number of vacancy chart.
Reflections
Overall, my planning could have been better and I should have sketched a draft to help me form my dashboard design better, and potentially experiment with a few different charts outside of my plan.