


The penultimate dashboard week challenge was an intriguing one: diving into the in-game economy of Path of Exile using data from over a year’s worth of item prices and trading information. The aim was to analyse how item values change over time, with in-game currency - Chaos Orbs - as a consistent metric of value. The data
Planning the Approach
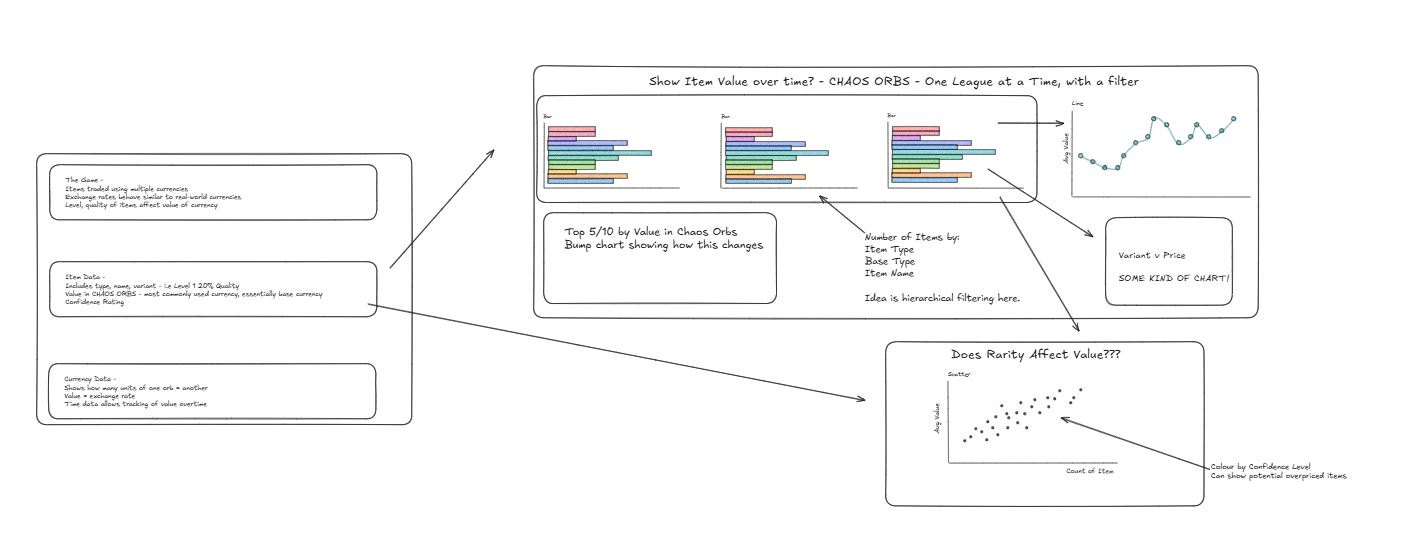
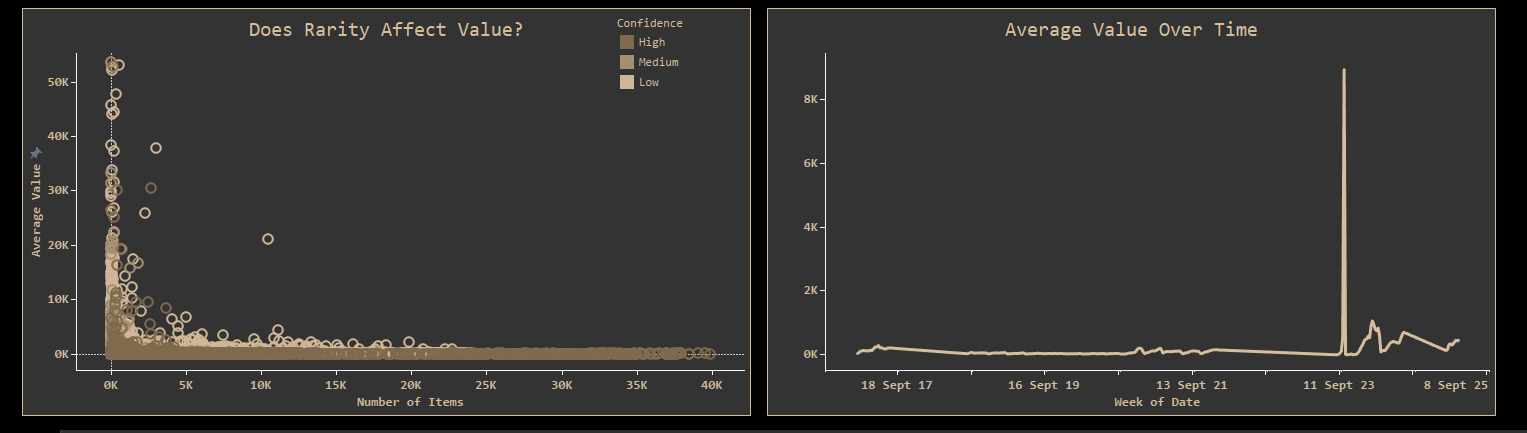
My first step was to sketch out a rough plan and a few chart ideas. After exploring the data, I knew that I wanted to focus on tracking average item value trends over time, while also exploring how the scarcity of certain items might influence their value. This would mean paying attention not just to prices, but also to how frequently items appeared in the data. The goal was to create a dashboard that could reflect these dynamics in a clear and engaging way.
Loading in the Data
However, progress wasn’t entirely smooth. The dataset came split across 40+ .csv files – one for each day and league – and loading them into Alteryx proved more time-consuming than expected. While I eventually got there, the effort did slightly eat into the time I’d hoped to spend on deeper analysis and design.
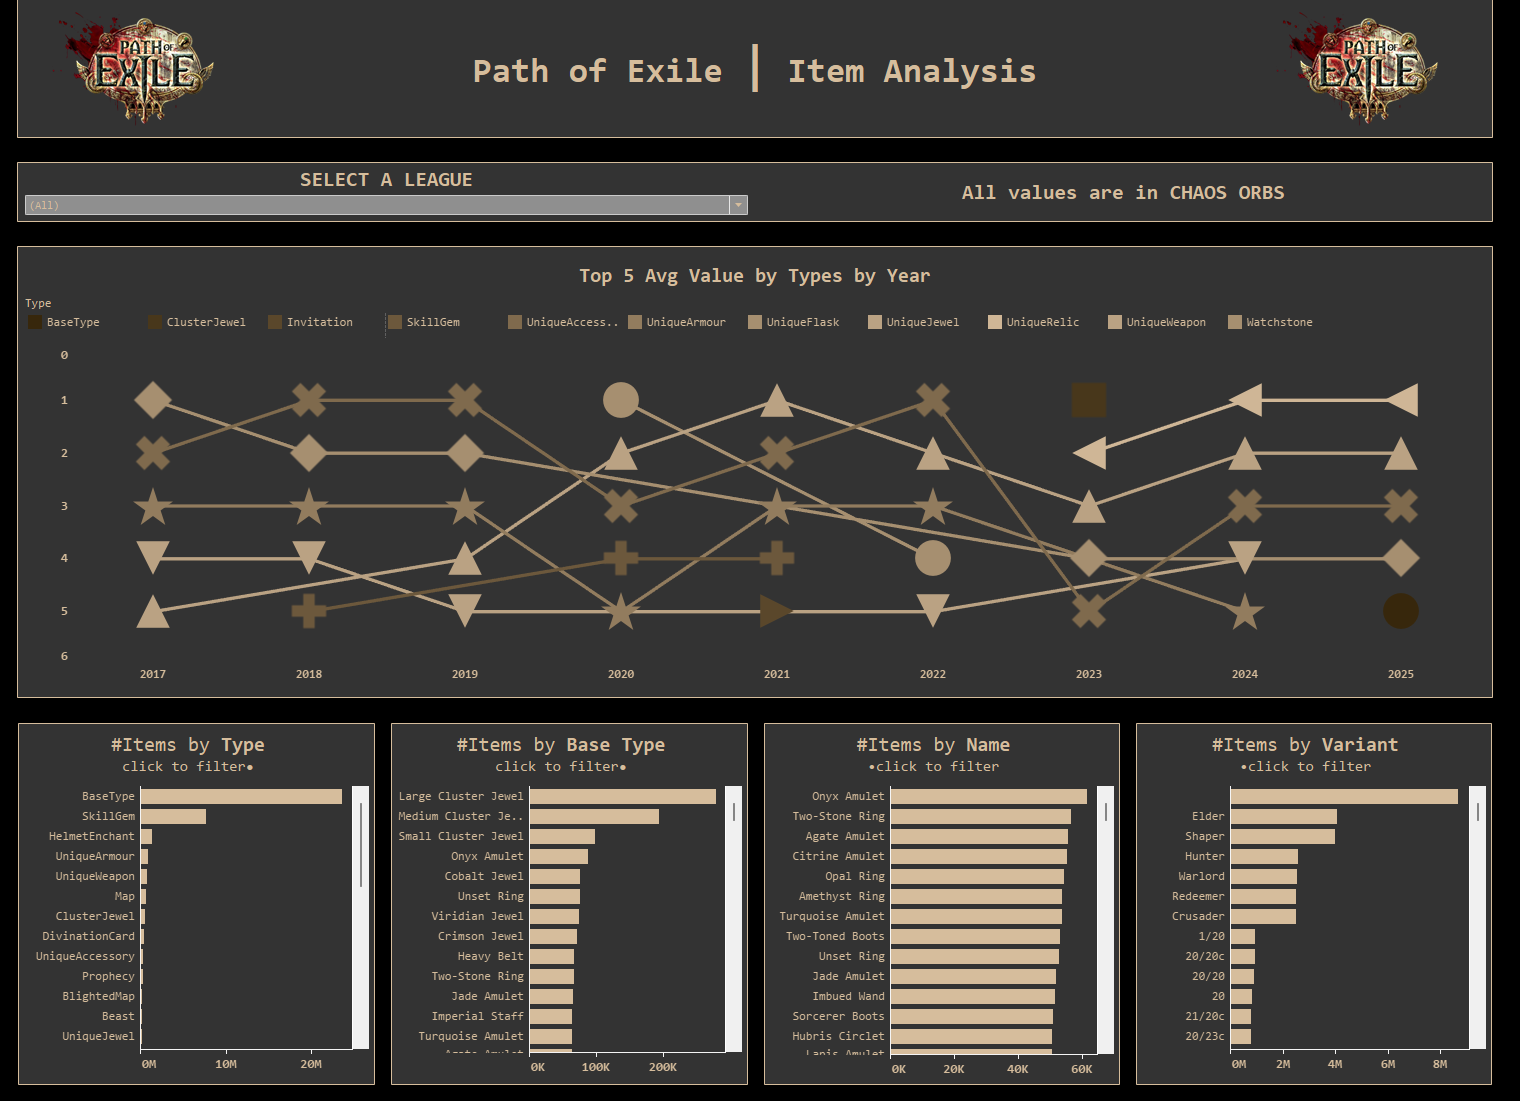
Once the data was ready, I focused on usability and design. I built the dashboard so users could filter by League, making it easier to focus on particular item types or individual items. I also spent a lot of (probably more than I should have) on creating custom colour palettes and my layout with the goal of making it as engaging as possible. I wanted to ensure that prospective players could explore trends specific to their interests without getting lost in the volume of information. View the dashboard here. (A lot of leagues had to be filtered out to adhere to Tableau Public's row limit!)
Final Thoughts
Looking back, I would’ve liked more time to explore the currency data in more depth – it felt like there was a lot to be explored there that I missed out on. I also realised that the metric I used for ‘number of items’ wasn’t quite capturing the insight I was hoping for, so for future steps I'd ensure to clarify with the stakeholder as early as possible.
All in all, a challenging but rewarding day – and a fascinating look into a virtual economy that mirrors the real world more than I expected.