The order in which Tableau executes varios actions is called Order of Operations. In this context operations are all filtering actions, sets, parameter actions, LOD actions, table calculations, total, MIN and MAX functions, trend lines, reference lines etc. Tableu offers the following diagram:

In this blog I aim to explain how these work.
Definitions:
Extract filters: This is a filter applied direct on the extracted data source.
Context filters are filters that gets applied before any other filter, applied on a worksheet. It is an independent filter and all the other filters will be applied to the data that is fetched by the Context filter.
Dimension filters: Eg. When City=London; when State = Alabama; when Sub-category = Chairs.
Measure filters are also called filter measures are filters that are applied on measure fields.
Date filters are treated either as measure filter for the continuous dates or dimension filter for disrete dates depending on weather the date is continuous or disrete.
Table calclulations are a type of calculated field that computes on the local data in Tableau that is currently in the view and do not consider any measures or dimesions that are not in the view.
Sets: subsets of data created by the user based on certain subset of conditions.
Conditional filters are used to filter data based on chosen set of conditions. For example: sales over x amount,
Top N filters are used to return a set number of top or bottom records in the field regardless of the values.
Fixed LOD or fixed level of expressions are calculations that are used on sets compute values using the specified dimensions without refering to the view level of detail.
Include LOD expressions compute values using the specified dimensions in addition to whatever dimensions are in the view.
Exclude LOD expressions declare dimensions to omit from the view level of detail.
Data blending: A method for combining data from multiple sources
Forecasts: forcasted values in a view with at least one date dimension and one meausre in the view.
Table calculations: Calculations based on what is in the view.
Clusters or cluster analysis is a way Tableau groups values by similaritiy to each other.
Totals are grand totals and subtotals in the visualisatonare the total in the table
Trend lines are used to highlight trends in the data in the view.
Reference lines are used to benchmark the data in the view.
Tableau, similary to mathematics, is performing the operations in a specific order. This is the order in which Tableau processes data. It is important to have this in mind when we use calculations because adding the calculation at different level will give us different results. By default all filters in Tableau are independent in nature. If we have a filter for any measure, Tableau will filter for the filter chosen. The Context filters however act as a main filter before the dimensional filter, meaning that
The first thing Tableau does is to start from the top and check if we have any Extract filters.
Example:
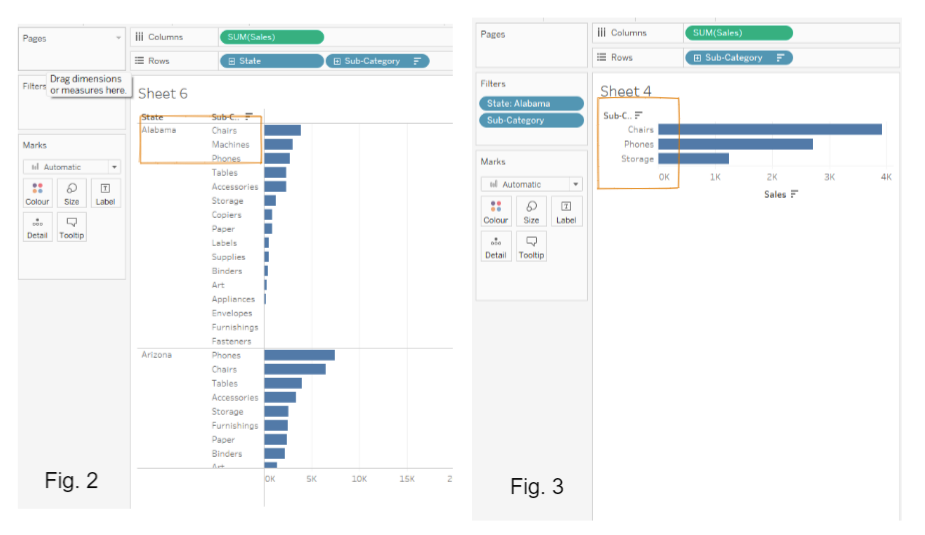
In fig. 2 bellow we have the sales per State and per Sub-Category. We can see that the top 3 Sub-Categories for the State of Alabama are Chairs, Machines and Phones. If we do the same calculation using the Top N filter for the Sub-Category (N =3) we get a different result for Alabama: Phone, Chairs and Storage. We get two different results. The reason behind this different results is the Order of Operation Tableau manupulated data. Also, in effect we answer different questions. In figure 2 the question asked is: What are the top 3 sub-categories per state? In figure 3 the question asked is from the top 3 sub-categories, what sales were made in Alabama. In other words, in the first example we use dimension filters. In the secont example we use context filters. As we have already seen, context filters are performed before the dimension filter. This is why we end up with different results.

Ways to change the order of the operation in tableau
There are a few ways to change the order of operation to suits the needs of the analyst. Some of these are:
- Apply filter as a context filter - This is done simply by right clicking on the filter in the filter pane and selecting the option that converts the filter to a context filter
- Use a rank table calculation as a filter instead of Top N filter
- Converting a table calculation to a FIXED level of detail expression by using a calculated field with a FIXED LOD.
Resources:
An Introduction to order of operations in Tableau by Tableau Tim: https://www.youtube.com/watch?v=KbKSzD3okrQ
Tableau's Order of Operations: https://help.tableau.com/current/pro/desktop/en-us/order_of_operations.htm
Understanding Tableau's order of operations: https://www.youtube.com/watch?v=fyDY0_Ivy54
