


Interested to know how your customer composition changes over time?
Let’s have a look at how to do this using Tableau’s sample ‘Superstore‘ dataset.
We have the years 2015 – 2018 through the ‘Order Date‘ field.
We need to calculate:
- how many unique customers we have
- how many unique customers we have per year
- the date of each unique customer’s first order. This helps us assess how customer make-up is changing over time
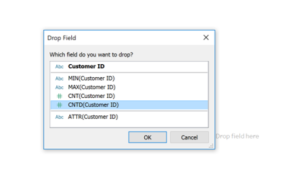
How many unique customers?
Right click and drag ‘Customer ID’ to the view and hit ‘CNTD’ – this is count distinct.
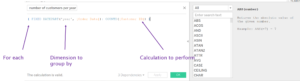
How many unique customers per year?
We use a level of detail expression here – create a new calculated field. We want to fix the number of customers on a per year basis. Even though we have greater detail than this, our brief is per year so we fix the calculation at that level. For each year in the order date field, return to us the total number of distinct customers.
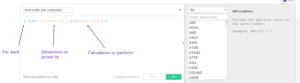
When did the customer make their first order?
This time in our new calculated field, we ask for the first date (minimum) from the data set and return that information for each unique customer (customer ID).
The final step requires that we calculate how these customer numbers change over the course of the available years. So we create this new calculation
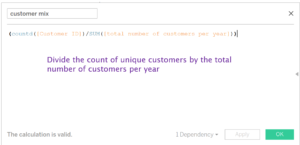
Note that we want the sum of the number of customers per year. So year 1 gets added to year 2 and so on.
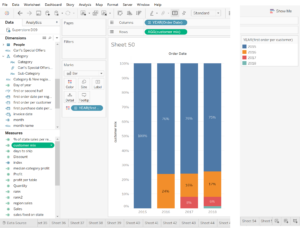
With a little styling and labelling, this is the result. Tidy little bar chart showing us that our 2015 customers are extremely loyal. Maybe we need to up our game for our newer customers?
Well, that’s all for now!
Any questions about this (or anything) give me a poke @AdiBop_ on the Twittersphere.