


At the end of my latest blog post, Dashboard Week Day 1: NHS Trusts, I wished that our next challenge for Dashboard week would be more concentrated on design.
It seems like my wish came true, since Andy for today task, asked us to create an infographic dashboard using data on The Avengers comic books series.
You can find the full requirements on Andy’s post.
The first thought I had when I saw the dataset, was to use Alteryx to web scrape some additional information. Unfortunately, I did not manage to make this work, so I changed plan and I tried to sketch a dashboard only using the original field present in the dataset.
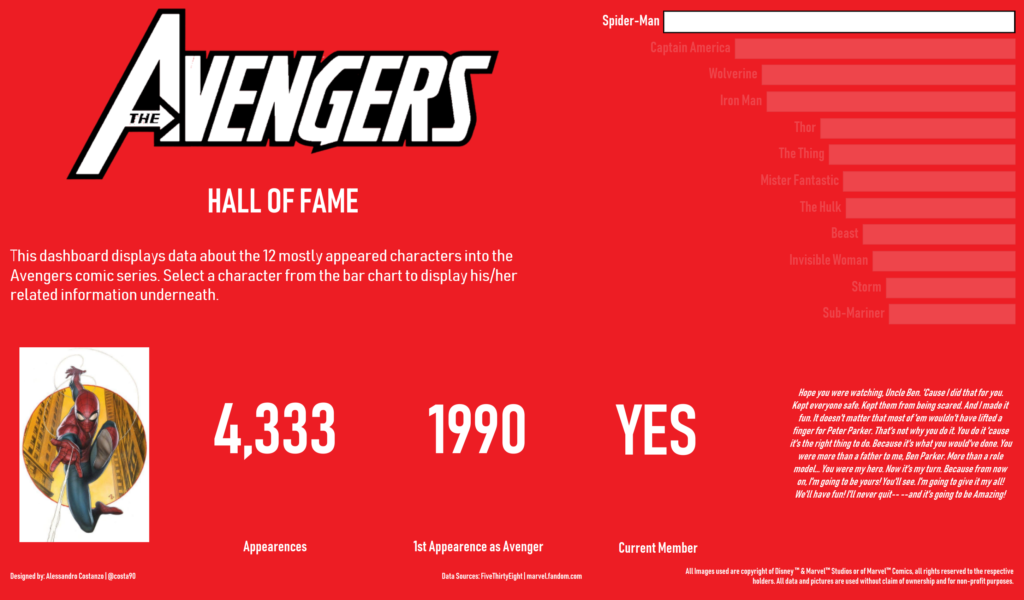
The idea I had in mind was to produce a long dashboard which would display the top 12 characters by appearances, including their picture and some extra information. I also planned to design the dashboard in an asymmetric way, mimicking a comic book.
Unfortunately, I had to change my original plan due to a time restriction. We are only allowed a limited number of hours, and on top of it today I run a webinar session on meetup.com, on which I spent roughly 1 hour.
I tried then to use the time restriction as an opportunity and thought to a way to reproduce something close to my original idea, but that would be less time consuming.
I then decided to add a bar chart with the character names, which would perform a dashboard action on all the other sheets. Doing this saved me from performing the dashboard formatting for 12 different characters, allowing me to finish on time. Here you can see the final result.
I really liked today project, I’m just sorry that I could not itearate more, and make it look exactly like I had it in mind. I now look forward to our Dashboard week finale tomorrow, stay tuned to see what we’ll create.