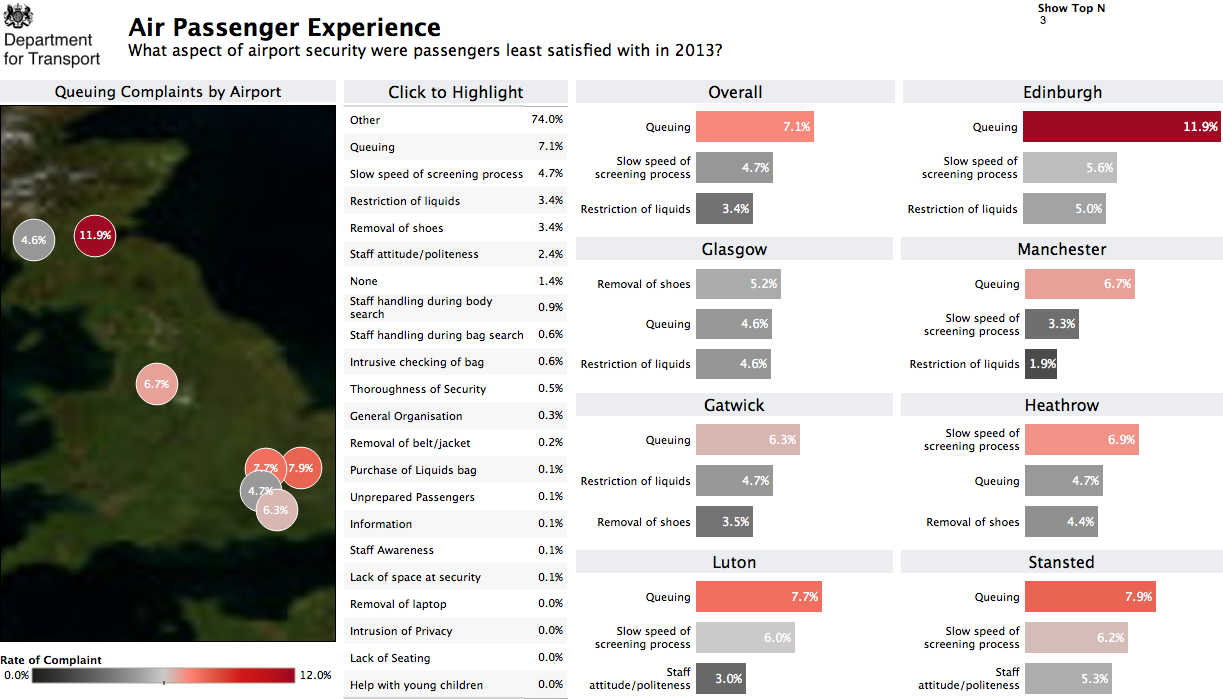
This week at the Data School we’re going back in time and using an older version of Tableau each day. Wednesday was my first day back at the School post-#DATA15 so I joined the team in building a dashboard in Tableau 6. We used this data set about air passenger experience of security screening in 2013 at UK airports.
The first obstacle to overcome was installing Tableau 6 on my Mac. You see, back then Tableau for Mac didn’t exist. I fired up Parallels and got Tableau 6 installed without any issues. Next, I had to prep the data. I did all of that directly in Excel, so no problems there either.
Lastly, I had to build a dashboard. It’s interesting how quickly you become accustomed to the latest features. For example, there’s no RANK function in Tableau 6; I used the INDEX function instead. Maps don’t work either, so I had to use a WMS map.
Overall, it was fun for me to go back to v6. It helps me to appreciate all that Tableau has done to make the product even more amazing.
Click on the image below to interact with the dashboard.