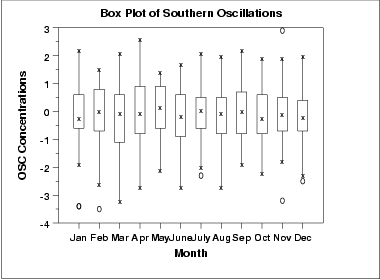
Day 1 has passed with me screwing everything up, getting the office blocked by Parkrun and having to give the team a last minute data set. Now we’re onto day 2 and the team will be visualizing Southern oscillations to predict el nino effects based on data from the NOAA.

Today, the team will need to get the data from the website, use the predictive analytics tools in Alteryx to identify future El Ninos and then visualize the results in Tableau.
