This morning, I learned a lot about Rick & Morty and I’m not so sure my son should be watching it. Anywho, today the team will need to use an API from the U.S. Energy Information Administration to visualize how Americans use energy. Each of them will need to pick a different category then download, prep and visualise the data.
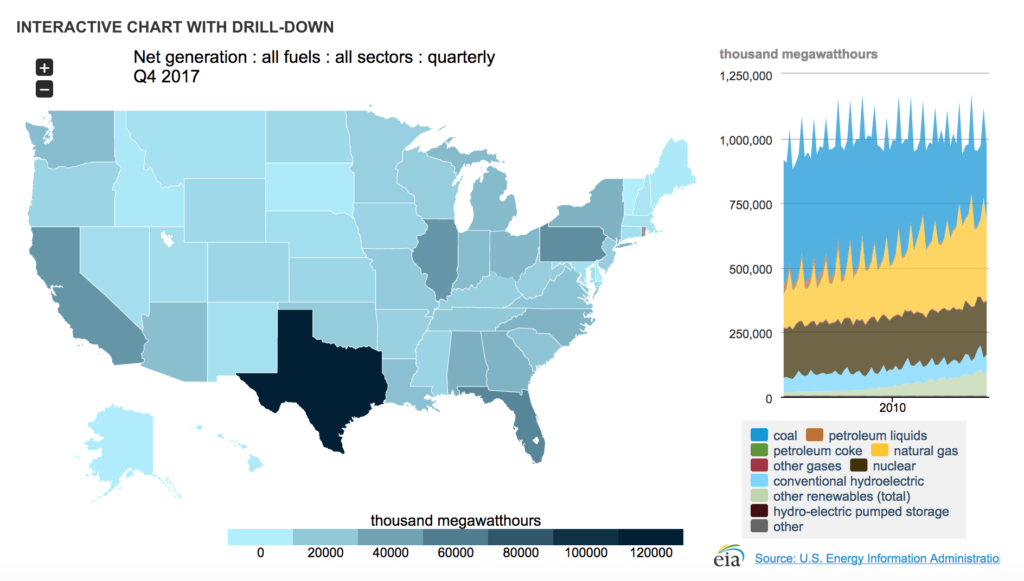
Here’s an example dashboard from the EIA: