


I’m off to Madrid this morning for my third marathon. And if there’s one thing runners like, it’s their data! So for their final day of dashboard week, I’m challenging DS5 to visualise my last 286 runs. The time period goes from 21 July 2015 to 20 April 2017. I know some very particular things about my runs and I’m curious to see what the team can find.
I woke up feeling a bit nicer this morning (heading out for a holiday will do that), so today I’ve created the workflow and TDE for them. Plus, I don’t think they’d have much time to create very good dashboards today if they had to do the workflow as well. The workflow looks like this:
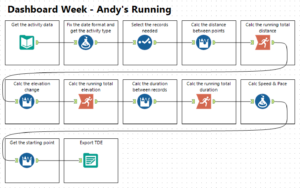
REQUIREMENTS
- Data comes from Runkeeper. The 286 GPX files that make up these runs have been combined into a TDE, which can be found here.
- Metrics that must be included in the dashboard: Distance, elevation, duration, speed, pace
- Must include routes for each run
- At any point of the run, I should be able to see my cumulative distance, cumulative elevation, cumulative duration, average speed and average pace.
- Distance should be displayed in miles. In the TDE, distance is in meters.
- Duration should be displayed in hours, minutes and seconds as appropriate. The data provided is in seconds.
- When you start struggling with displaying duration properly, you might want to read Jonathan Drummey’s blog post on formatting time durations.
Join us at 3pm BST for their final presentations for the week. They’ll be presenting whatever they build with this data set and their favourite from the rest of the week, so two workflows and dashboards per person.
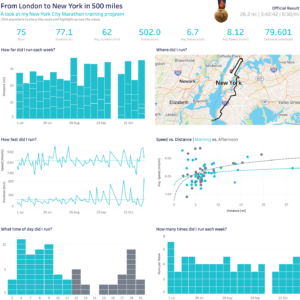
The presentations will be broadcast on GoToMeeting. I’ll be watching from a Spanish cafe somewhere in Madrid. If you need some inspiration, here’s what I built for the New York Marathon back in November.
Have fun!