


Now that we have cohorts every two months, that means twice as many dashboard weeks!! Yay!! More torture!
I’m changing things up a bit for Dashboard Week for DS11. First, they haven’t covered APIs yet, so I won’t be giving them any APIs to play with. Second, I don’t like how previous cohorts have stayed so long at the office and are completely burned out at the end of the week. To address this I am:
- Setting a 5pm finish time
- Requiring them to leave their laptops at work
- Not going back in versions as I have with previous cohorts. They had to work with 10.5 last week for their client project, so that’s good enough.
I still have some other tricks up my sleeve, so don’t worry, I won’t make it too easy. Let’s move onto the Day 1 assignment.
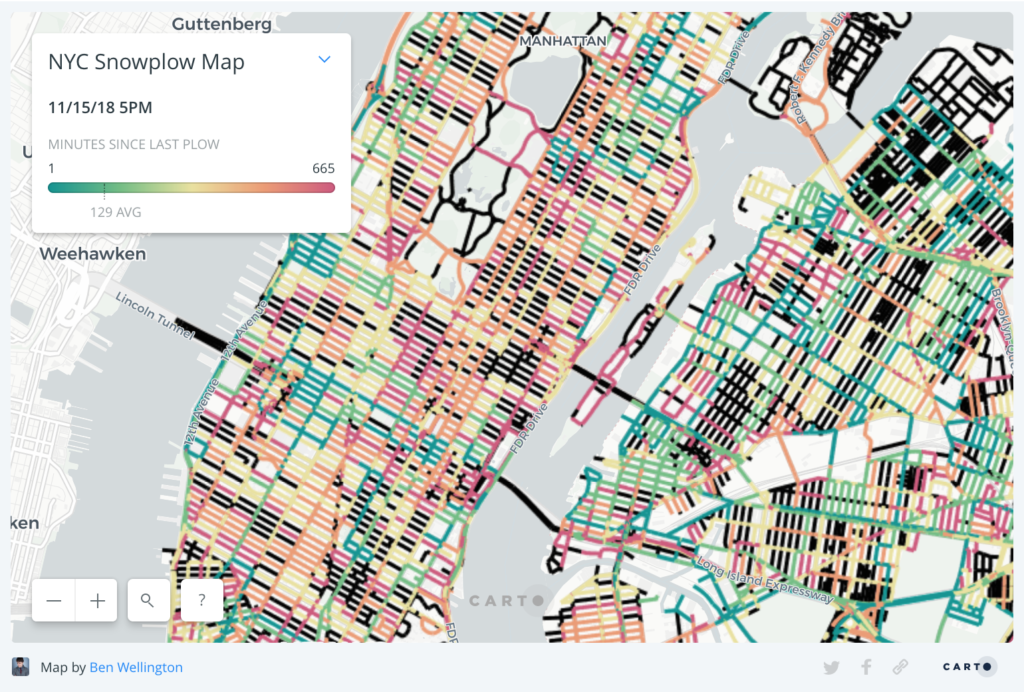
Today, the team will need to visualize a fascinating data set about the last time a particular segment of New York City’s street were snow plowed. This data set is 253M records, so they better be careful. They should upload it to Exasol before they do anything else.
There are three useful links for them:
- A case study that uses the snowplow data.
- The raw data from NYC Open Data.
- New York street centerline data, which provides the segments from the raw data in a map format.
Requirements:
- If data prep is required, I want them to use Alteryx.
- They are welcome to work as a team on the data prep.
- They must upload the data to Exasol before they can analyze or visualize it.
- Before 5pm, they must have their dashboards uploaded to Tableau Public.
The data sets are both very clean, so the trickiest part will be getting it uploaded to Exasol. This will probably require a bit of research, which I would advise they do as a team.
Good luck to them!