The weather has been unusually nice here in London the last few weeks. We had record heat for about a week (it wasn’t all that hot, but they like to complain). Believe it or not, it actually doesn’t rain that often in London; it’s the greyness that gets to you.
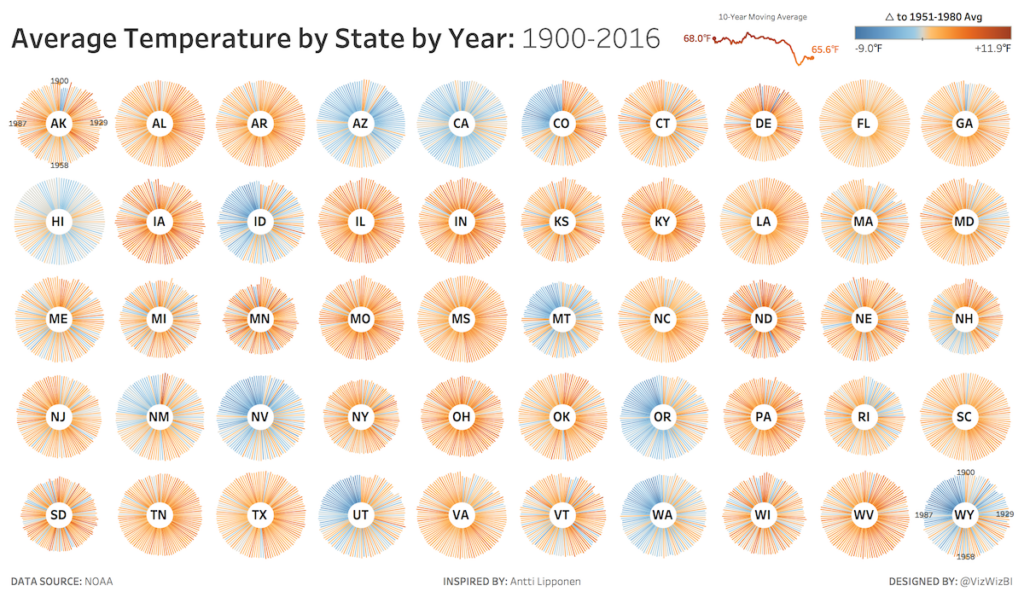
Anyway, DS20 really did well with the MLB data for day 1. For day 2, they will be creating a KPI dashboard about historical temperature and precipitation. The data comes from NOAA all the way back to January 1895. The data is really simple and there’s a nice README file to go with it.
The data is super granular geographically, so maybe Alteryx will help generalize it if need be. The data is in a 5×5 lat/lon grid and US States have boundaries. So, I would think it possible to match each point to a State. That’s something I would explore, but I have no idea if it would be useful.
Like yesterday, the goal is to create a KPI dashboard. If today is anything like Monday, they’ll be fine.
