


I’m the luckiest person on the planet. Not only am I getting to teach the next generation of Tableau Zens and Alteryx Aces, but I get to attend the Data School as a student myself. In particular, I’m soaking up all I can about Alteryx. Monday, the Love Doctor (a.k.a. Chris Love), taught an intro session on spatial analytics with Alteryx. He’s quite an amazing coach and has a great way of explaining concepts to get you to the “aha!” moment so much more quickly.
We covered four topics:
- Manually creating a simple polygon with points
- Creating polygons based on UK postcode sectors
- Creating polygons of UK postcode areas, which required some grouping of the data from exercise 2
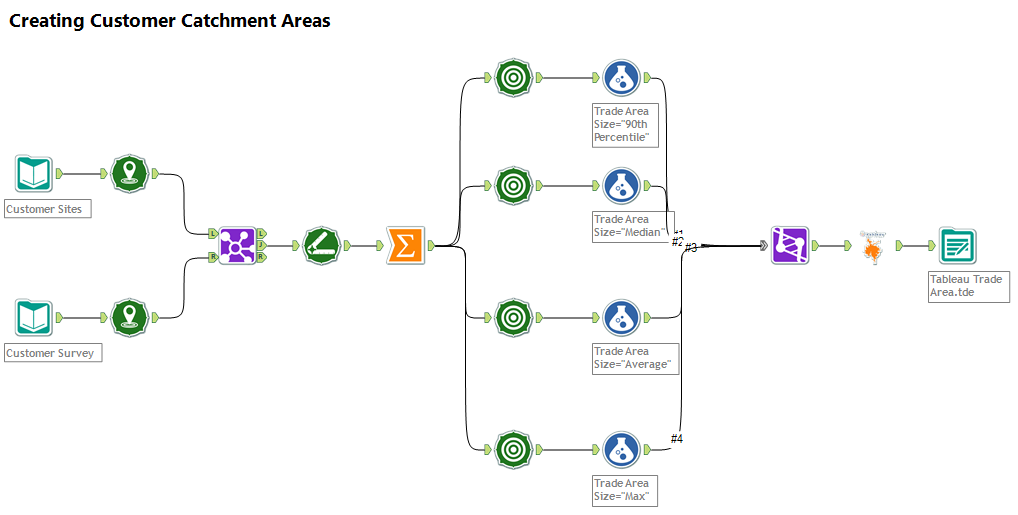
- Building custom trade areas
For the last exercise, I decided to go a step farther and create four different trade areas and allow the user to selection the option they want to view in Tableau. Here’s my Alteryx workflow (click on the image for a larger view):
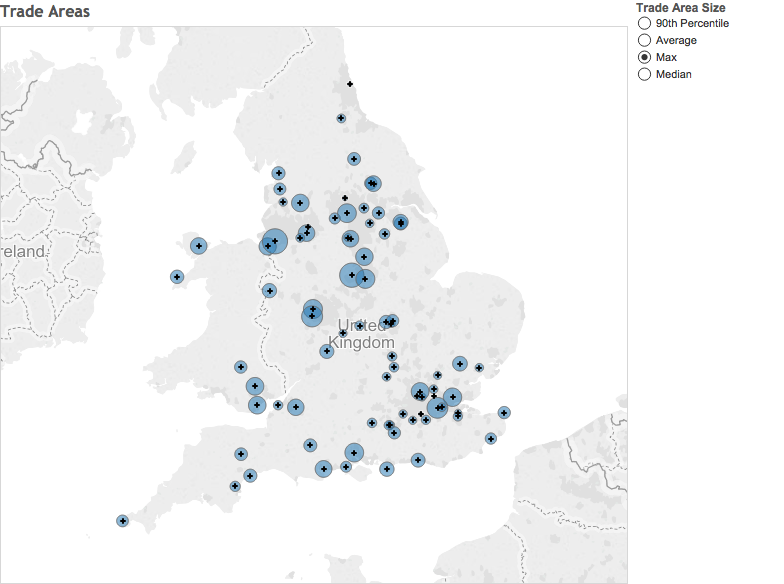
And here’s the Tableau viz. Notice how I include the centroid of each trade area as a + mark. That little trick was done with a dual-axis. Click on the image to go to the interactive version and to see the output from all four exercises.
My overall impression of spatial analytics in Alteryx? One word: simple. Alteryx makes it’s incredibly easy to create just about any spatial data set you can imagine. I can’t wait to see what the Love Doctor has in store for us in the advanced spatial analytics class!