This week at the Data School we’re taking on the challenge of a dashboard per day. This is going to be a bit tougher given the time it takes to create nice dashboards. Monday started with the team practicing their Alteryx/Tableau demos followed by a class I taught them on effective colour design.
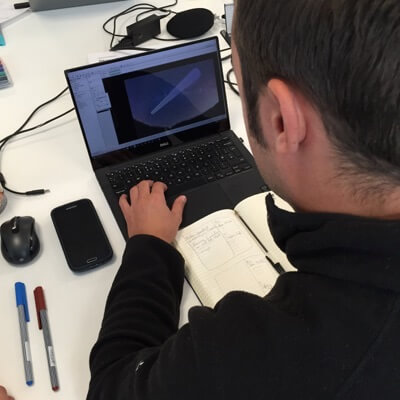
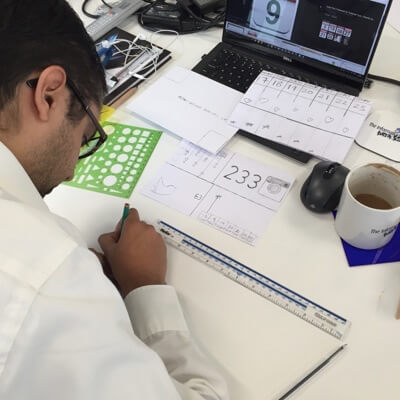
After lunch I gave them a super small dataset, two numbers: 233 and 65. They had to use Tableau to build as many visualisations as they could in 2 hours. This activity is based on this post from Santiago Ortiz called “45 Ways to Communicate Two Quantities”. It’s a really fun exercise because it’s so simple, yet so difficult. The team came up with about 70 or so different visualisations.
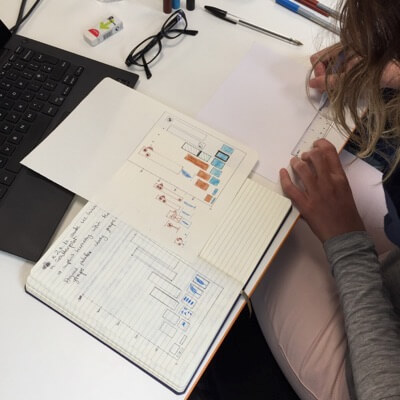
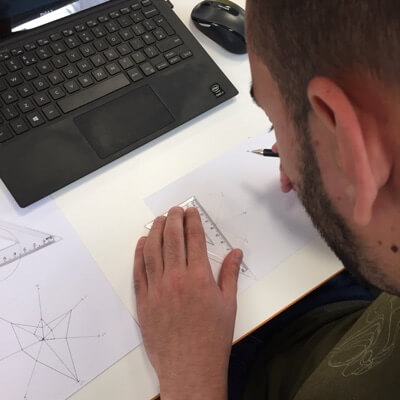
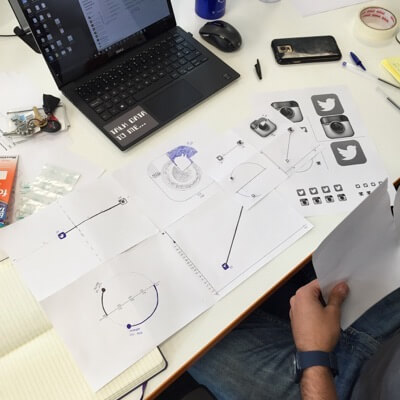
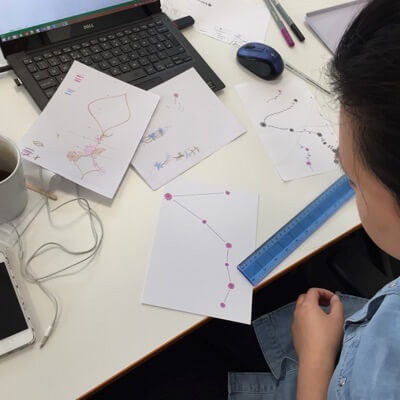
This morning we picked this activity up, but instead of working on their computers, they are creating an analogue version to send to Jeffrey Shaffer for week 20 of the Dear-Data-Two project. I can’t wait to see how their postcards turn out. In the meantime, here’s the team working hard on their postcards.