Our last task for dashboard day was to use Uber data and create a visualisation. As the blog post says, our biggest constraint today is time! I have chosen to use Stockholm’s travel times by hour of day in 2019 q1 and the geo boundary data.
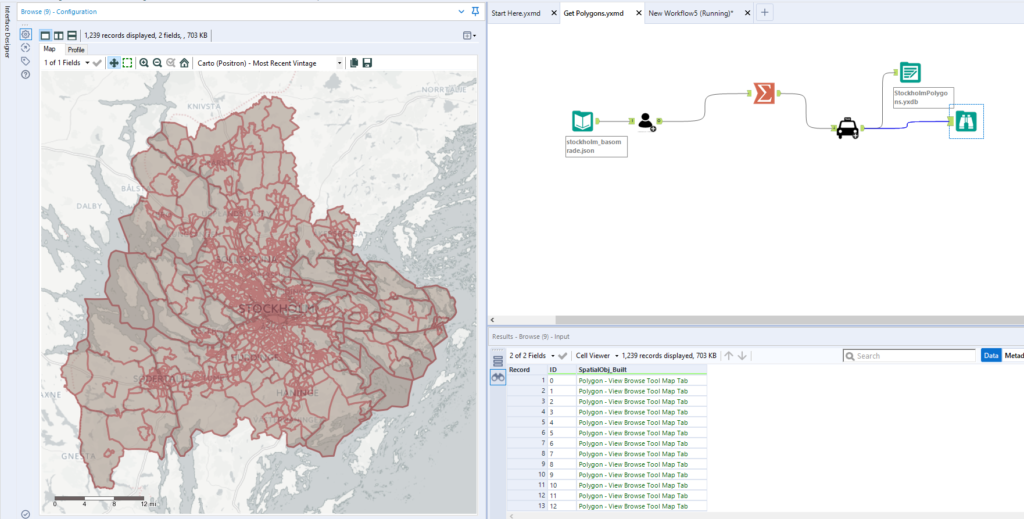
The travel times data seemed ok from a .csv but maybe not that exciting from the fields we have so the geo boundary data was a JSON file which contained all the longitude and latitude values which would need to then create our own polygons from this data. I ended up creating a standard macro (to keep things clean) and a batch macro to build each polygon. This was quite a time consuming workflow and instantly regretted not using cache and run! This was a good task using spatial tools and a batch macro.
This is how my workflow looked to get the polygons for each area in Stockholm:
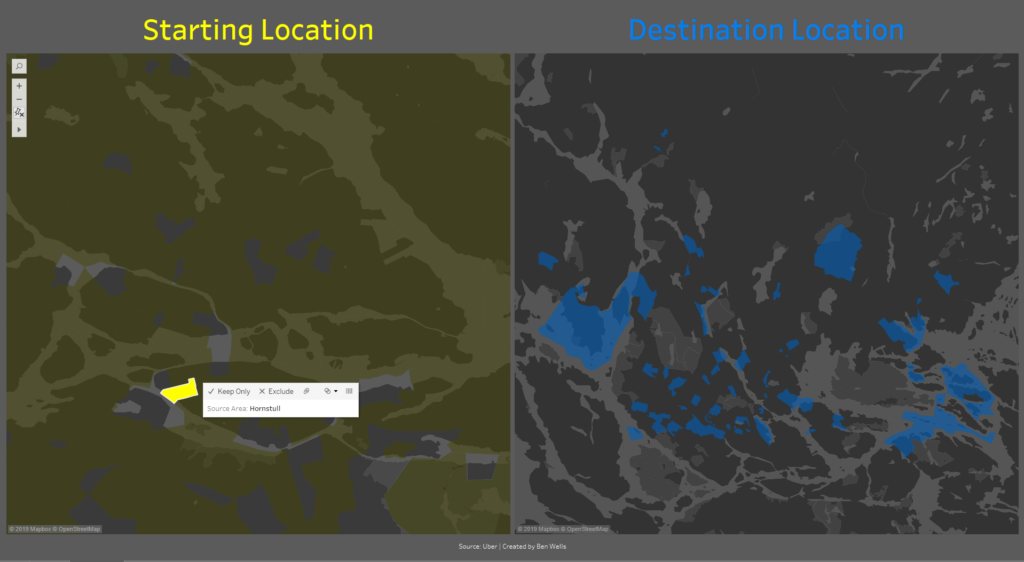
Next all I need to do was join the polygons data to the source and destination ID from the .csv data and output this as .tde to begin my viz in Tableau. As our big problem today was speed the length of time creating the polygons and saving as a tde. was not helpful! But at least in the meantime I could write my blog and plan my viz! I then realised I didn’t have the names of the areas of each polygon and realised this is very useful context for the viz, so it was back into Alteryx to join this on and run the workflow again. In order to save some time, I thought it would be best to do a random sample for 1 in 50 chance rather than the 3,000,000+ so I could get something ready for presentations! I could run it again for all rows later one I had created a wire frame of my viz. I ended up only having a short amount of time to do my viz so it needs a lot of work! So I thought I would go with two maps, you select your starting area from the left map and the destinations of where journeys from your starting area went. I didn’t expect the polygons to be as granular as they were so a future investigation would be to group these into bigger areas to see if more insights could be seen. Check out what was thrown together in Tableau below: