Hey everybody! I’m Charlie, one of the new recruits with DS7. I’ve come here fresh from studying for my masters – I was researching the application of remote sensing to high latitude vegetation in Russia, based at the Scott Polar Research Institute in Cambridge. It was very interesting, and very niche. I also spent a lot of time fighting software, trying to achieve seemingly basic things which became increasingly complicated as I tried to communicate to my computer what I wanted it to do. This is feeling like a pretty classic Tableau origin story by now, right? Whilst I’ll always to love a good map, I’m keen to broaden my horizons during my time with The Information Lab.
Intro over, let’s blog.
I’d like to tell you about a little thing that we all learned today. Amongst the many pieces of information imparted to us as we started out on Tableau 101, this sticks out in my mind because of the fact it was a useful tip for Andy – it was suggested by Heidi, who’s currently spending time with us from the German TIL.
To set the scene, we were using the ‘Superstores’ data set to learn a whole bunch of Tableau techniques, and we had just reached hierarchies. Here’s a run-down of a process for creating hierarchies:
- Control + left click on the relevant dimensions.
- Right click on one of the included dimensions, and from the drop-down menu select ‘Hierarchy’ -> ‘Create hierarchy…’. Give it a catchy name, perhaps ‘Product Hierarchy’.
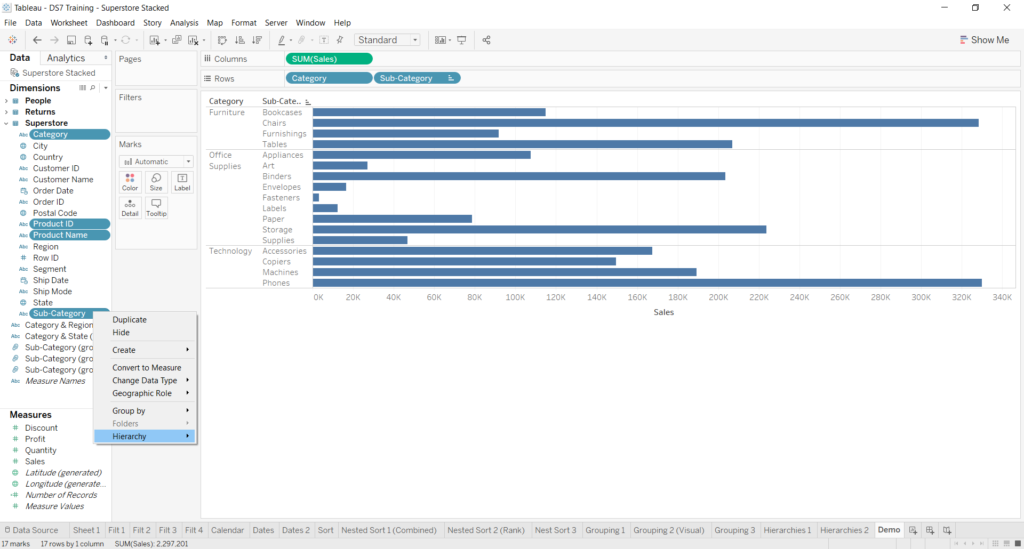
- Click and drag the dimensions within your new hierarchy so that they’re in a logical order. The hierarchy runs from top to bottom. The highest dimension in the list provides the main parent categories (usefully this was the ‘Category’ dimension in this example), whilst each subsequent lower dimension is a more specific subset of the dimension preceding it.
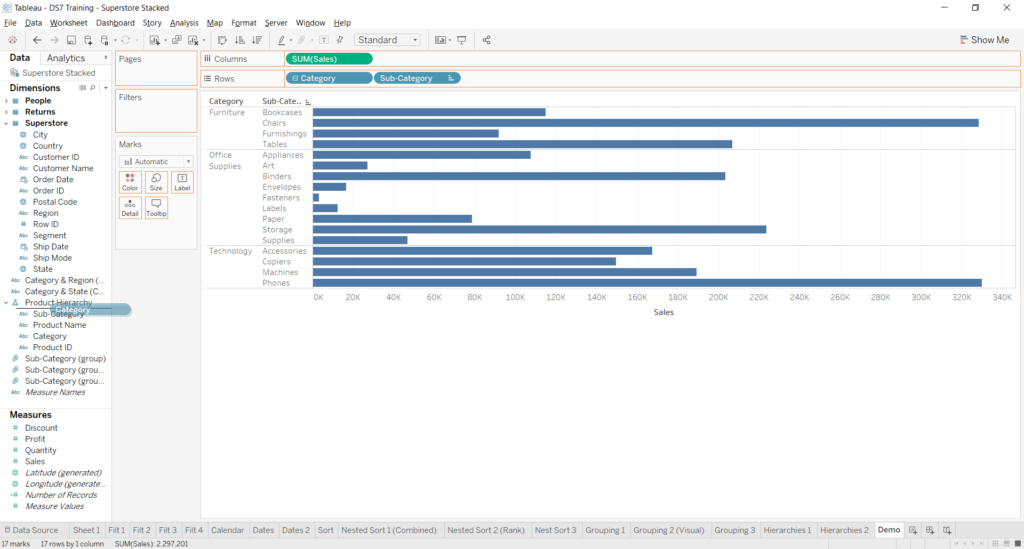
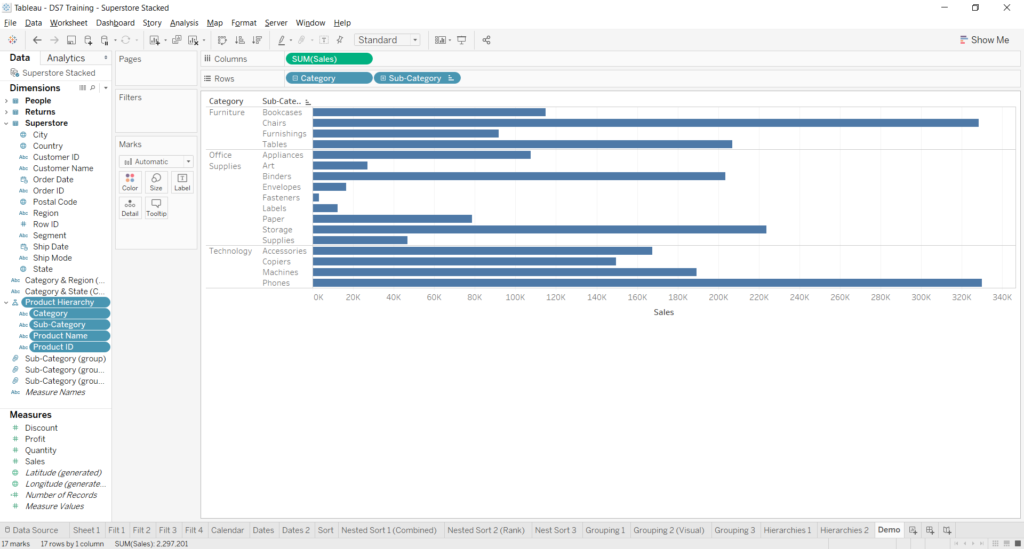
Simple! Your hierarchy should now be ready to use. The product hierarchy is highlighted in the data pane to the left of the screenshot below. The hierarchy is on the rows shelf, where the little ‘+’ sign to the left of the Sub-Category pill indicates that there is further nesting within – you can see from the data pane that this includes Product Name and Product ID.
So now we know how to create a hierarchy, let’s repeat the process for the geographical data within our dataset. I’ve plotted it as a map of Sales. Whilst this has little insight at the country level, it will become more useful as we dive deeper into our hierarchy and have more granular data to visualize. Plus, it’ll allow me to illustrate the problem that Heidi solved for us.
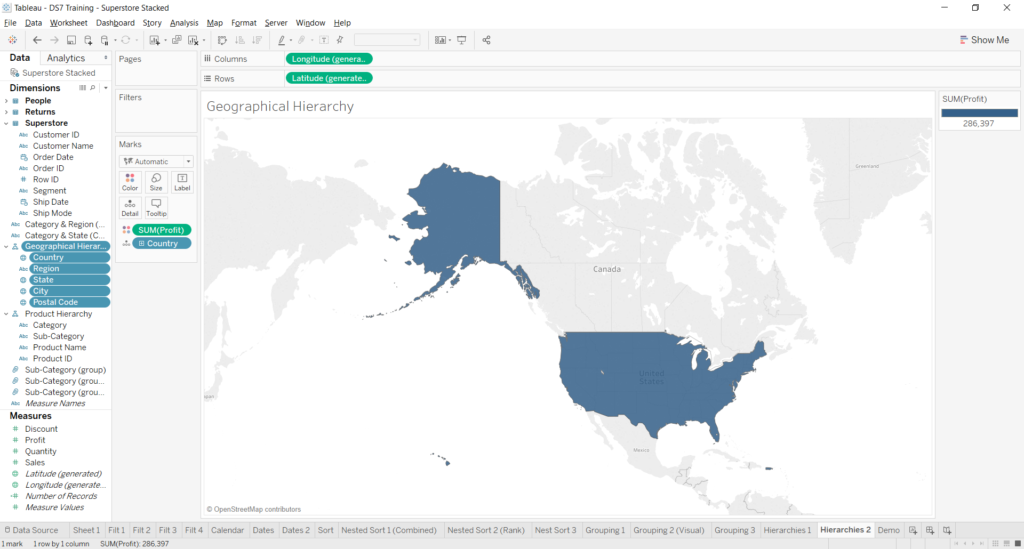
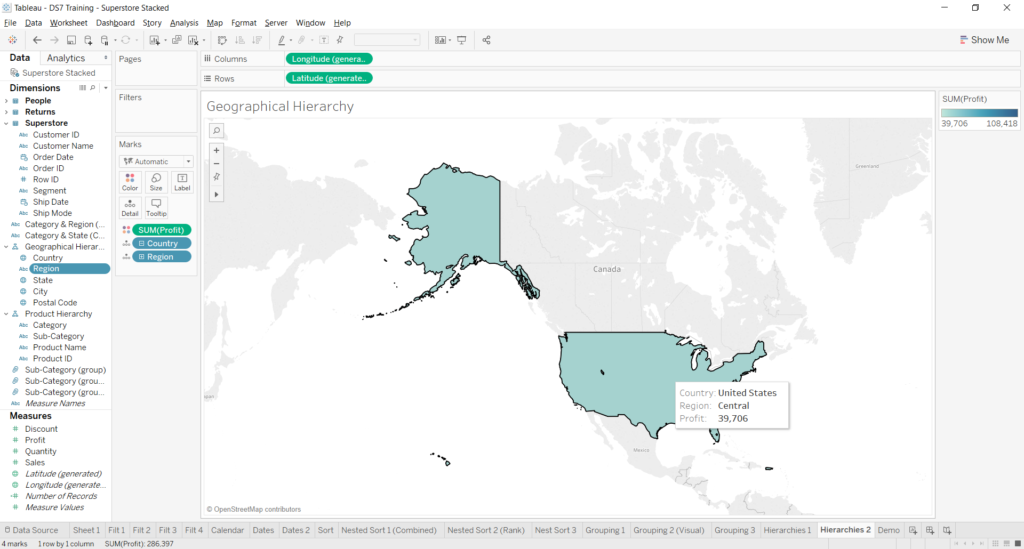
Root problem: The ‘Region’ dimension is not currently serving a geographical role, as you can see from the ‘Abc’ to its left in the data pane.
Problem manifestation: As we expand the hierarchy in the marks card to show data at the regional level, it displays incorrectly. The entire area of the US is assigned the value of the ‘Central’ region, as we can see in the tooltip here.
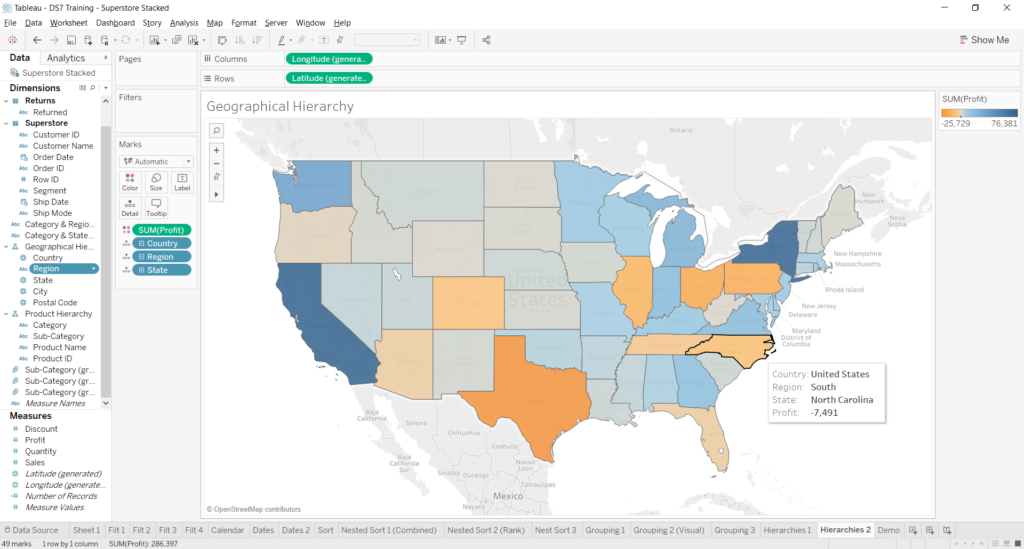
Once we expand the hierarchy again to show data at the state level, the display reverts to something useful, as Tableau can interpret the geographical nature of the dimension directly onto the map.
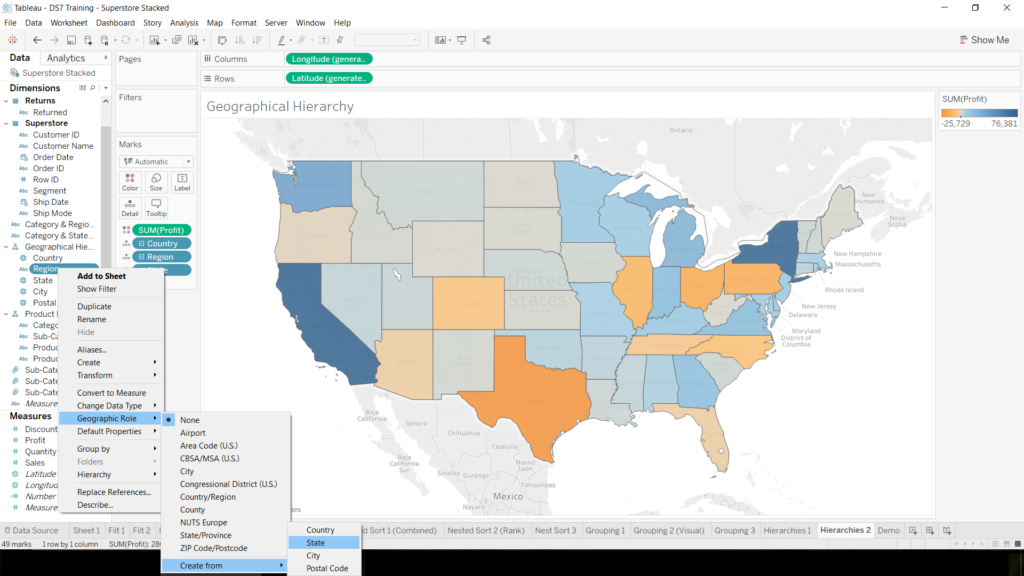
Heidi’s solution: By right-clicking ‘Regions’, then selecting in turn ‘Geographic Role’, ‘Create from…’ and ‘State’ from the drop-down menus, Tableau will transform the dimension from string data into geographical data.
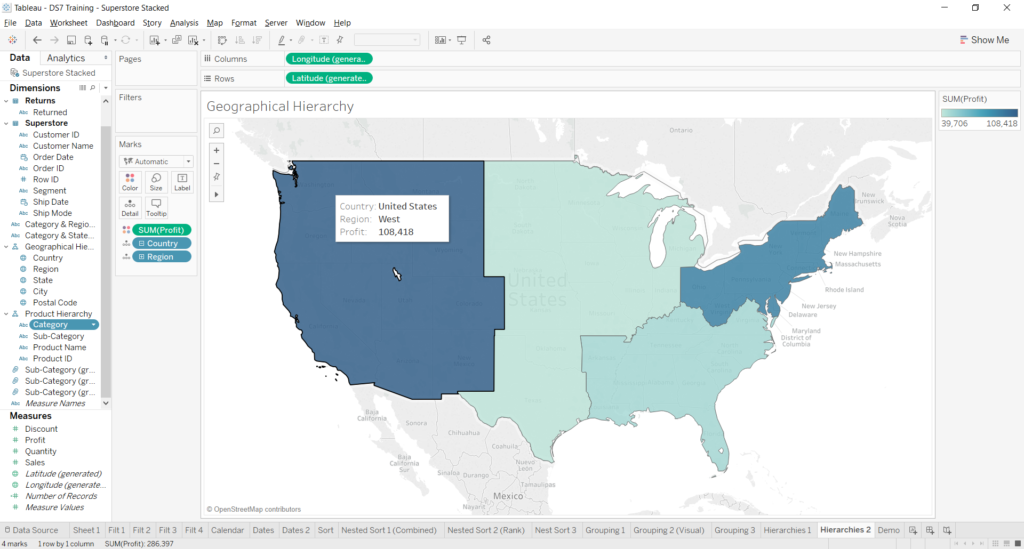
Now if we collapse the hierarchy back to the regional level, we have useable geographical data in this dimension to plot onto our map. Exciting. Thanks to Heidi for sharing this tip with us all!
So that’s a wrap on my first blog. You can find me on Twitter if you want to say hi, and Tableau Public if you want to check out my DS7 application visualisations and my first one hour Makeover Monday from DS7 day one!
