


Our project during the first week of DS7 was a classic: to makeover one of our application visualisations. I chose to revisit the data set I used for my interview viz, on NFL arrests.
Some positives:
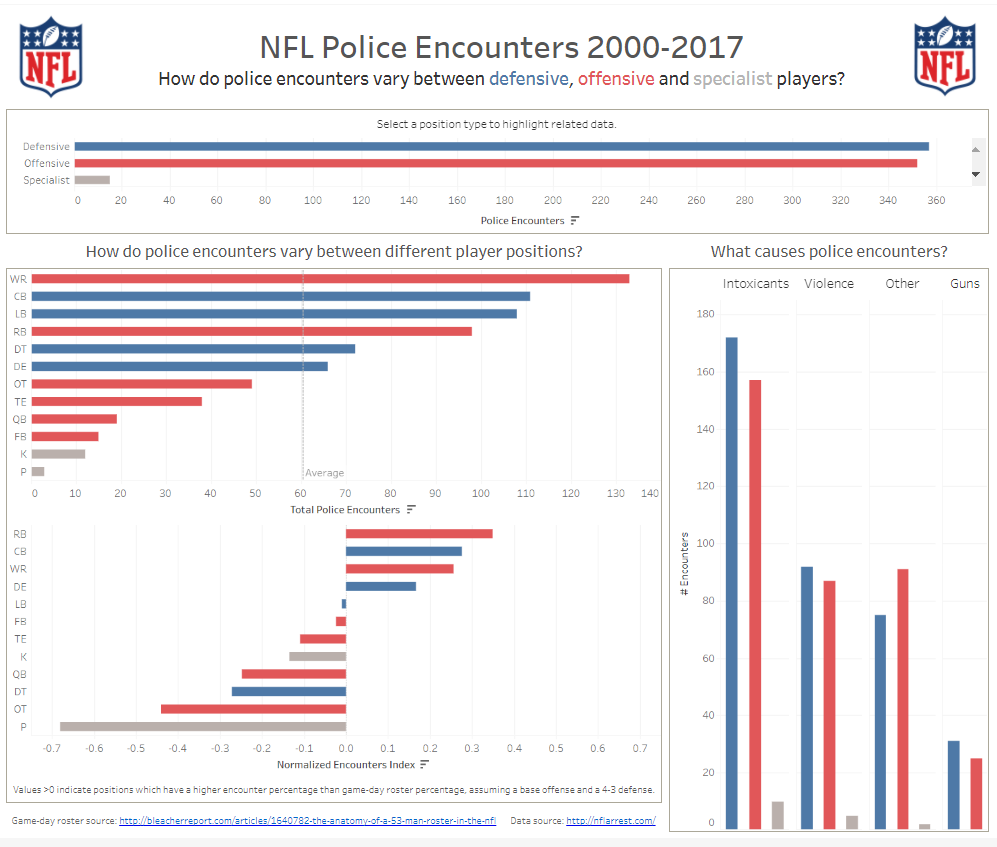
Phrasing sub-titles as questions allows the audience to quickly identify the purpose of each graph.
Utilises a simple, consistent colour scheme that is well-matched to the subject.
Clean design, free of chart junk.
Some negatives:
Lack of insight from the data – this visualisation doesn’t really tell us anything very interesting.
Useless graph – the middle graph on the left-hand side is immediately followed by a graph that shows the same data but in a more meaningful way, since it’s normalised for player distribution.
Flat layout – there’s no light and shade in the design of the dashboard.
The motivation:
I pivoted significantly for my remake. Really, the only common themes were the data set and the colour scheme (note to self – try experimenting with colours other than red and blue at some point). I quite quickly decided that the biggest issue with my original viz was that it lacked any significant insight into the data. Though there were a couple of interesting titbits, you’d be hard-pressed to use it as the basis for telling a good story. Remembering a comment that Andy had made during the interview, utilising my newly learned skills of calendar creation, and with a little help from Marcus’ blog on marginal histograms, I wanted to take a look at temporal trends in NFL player arrests.
The result:
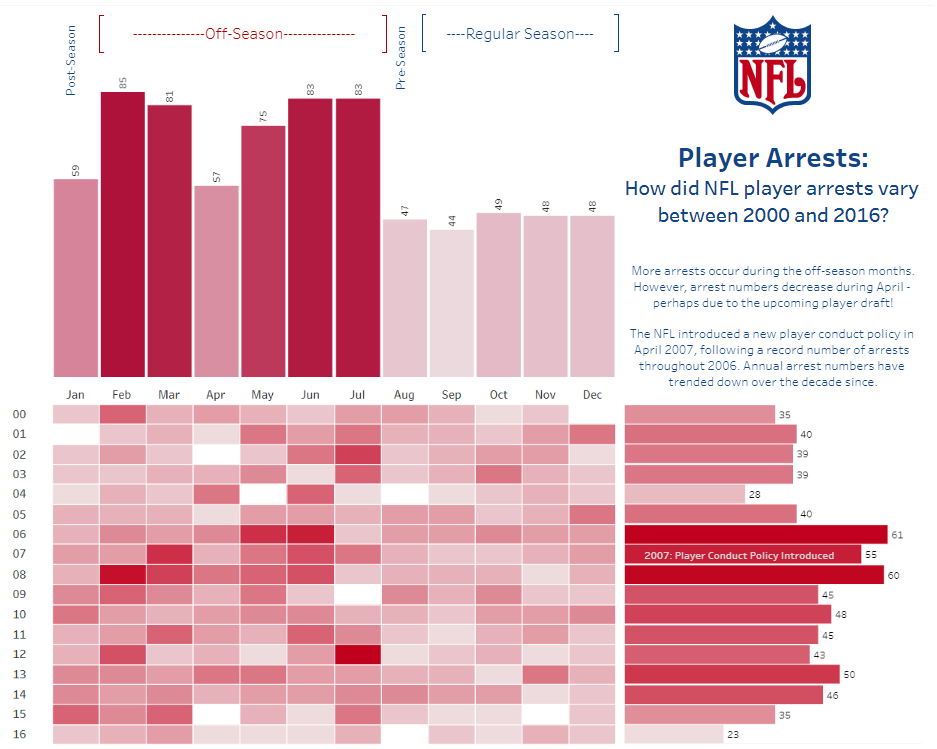
A marginal histogram was a good choice of graph for this data because it’s an efficient and visually pleasing way of illustrating temporal variation with relation to two scales of interest. In my case these were monthly – to examine seasonal trends – and annually – to investigate decadal patterns. Using this type of visualization, I was easily able to identify the variability in the data
Now, American football isn’t exactly my area of expertise, but having spent the last year living with a Seattle Seagulls fan I knew enough to tell that the monthly pattern coincided cleanly with the NFL season. With a little research I was quickly able to identify that the NFL draft falls in late April or early May each year, providing a good reason for the low number of arrests during April. Police encounters don’t help your employment prospects. Similarly, the introduction of the new conduct policy in 2007 showed up as a likely explanatory factor behind the recent decline in annual arrests. I annotated the visualization with these pieces of information to add some depth to the viz and allow the audience to see them in context, as well as adding a little text to draw out the details.
I played around with adding filters and highlight actions to the marginal histogram, but realised that the filters were unnecessary due to the nature of the graph, so there was no point adding an extra layer of complexity. Not having a highlight action in this situation is something that I believe comes down to personal preference. I like being able to hover over boxes or bars to view the tooltip without losing the context of being able to see the data that surrounds it, but I think there’s also an argument in favour of highlighting things to allow the user to more clearly see the particular piece of information they’re interested in. I’d be interested to hear what thoughts other people have about this.
The main piece of feedback I got for this viz was that the numbers on the monthly bar chart should be rotated horizontally. This is something I’d done in an earlier version but obviously forgot to change here. Triple-check your work, kids!