


Index


Intro
Welcome to a short series of blogs about creating one dashboard with Tableau Desktop, intended to include content across a variety of difficulty levels.
Who?
My name is Chris and I am a Trainee Consulting Analyst with The Information Lab UK. I’m roughly half way through four months of training with Tableau and Alteryx trying to develop my skills with the software but also other analytical and consulting skills.
We will get started today with talking about what will be made and the data used. Feel free to follow along and give it a go yourself.
The software
I will be using the data visualization package Tableau Desktop (version 2019.4)
The data
I’m using the Superstore dataset that comes with Tableau. It’s a great dataset for demonstrations and widely used in teaching due to it’s ease of access to those with the software and it’s quality.
Where can I find it?
If you have Tableau Desktop installed then you should have it in a location like: Documents\My Tableau Repository\Datasources\2019.4\en_US-US
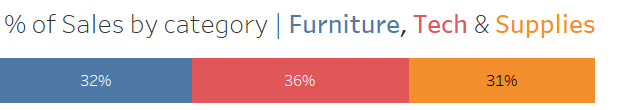
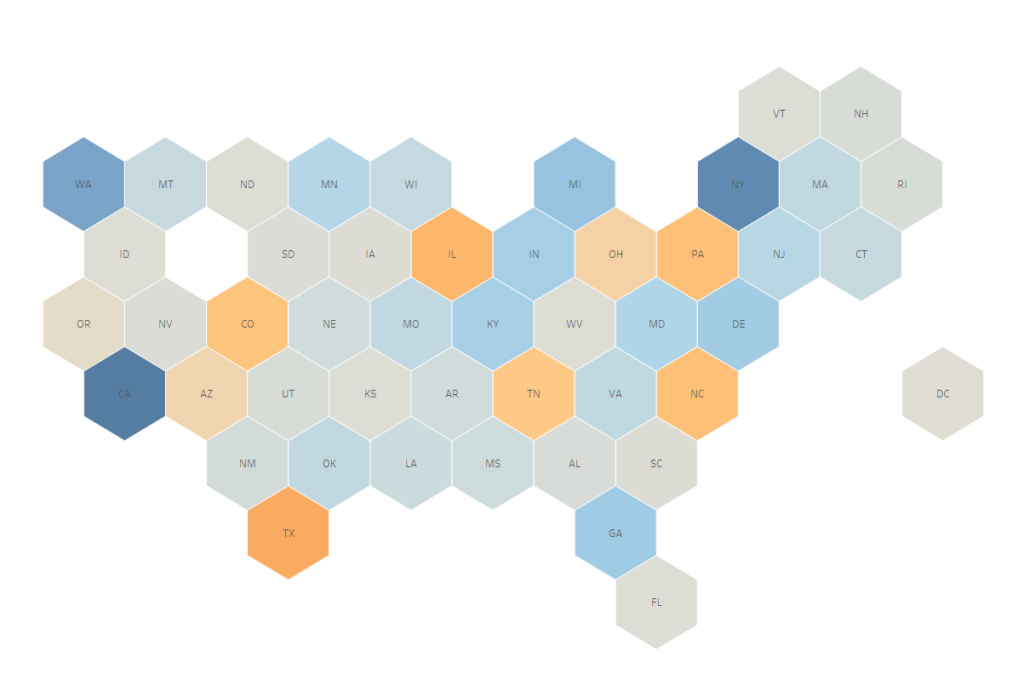
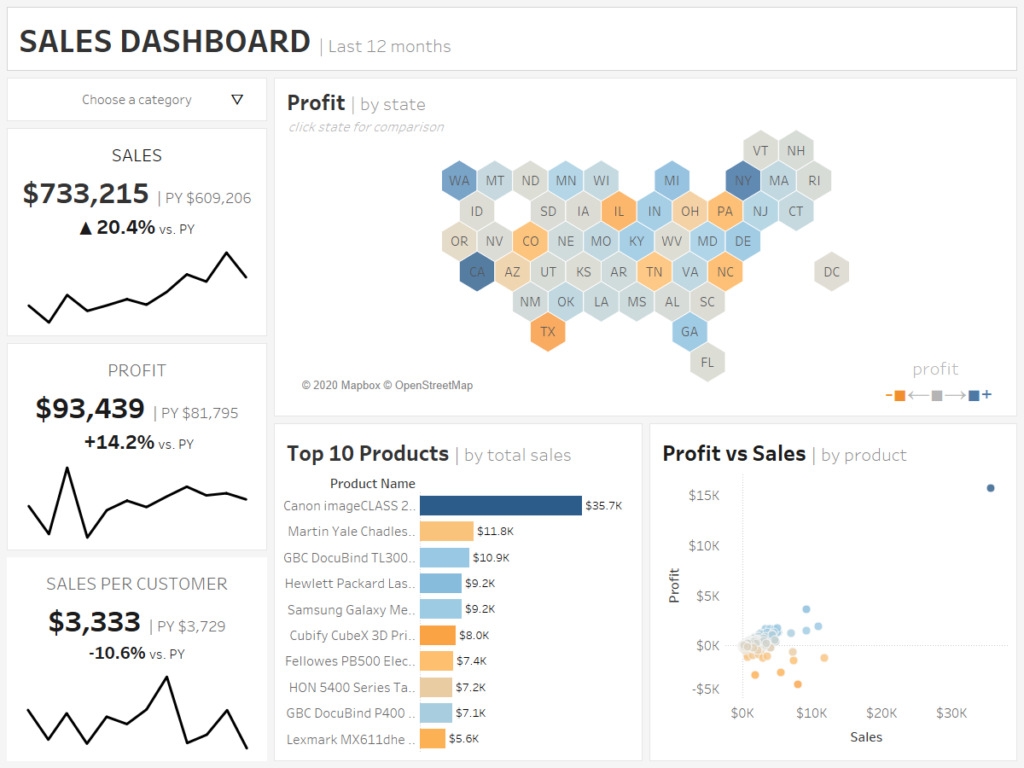
The Goal
Link: https://public.tableau.com/profile/chris.meardon#!/vizhome/SalesDash-DemoforBlog/SalesDashboard
Embedded:

Image:
The sign off
See you in the next blog getting started on some charts.