


Meteorite Data
Andy tasked us with downloading data from NASA which was relatively straight forward. See my final visualisation here
Trying To Make a 3D Globe
I then went a long, long way down a rabbit hole following Luke Stanke’s blog on creating 3D globes in Tableau. I got my points onto a globe using some amazing calculations from Luke, see below. The user can rotate the view with parameter toggles. However I had issues putting the country outlines onto the globe to provide context to the points. After two hours I moved on and made a dashboard.
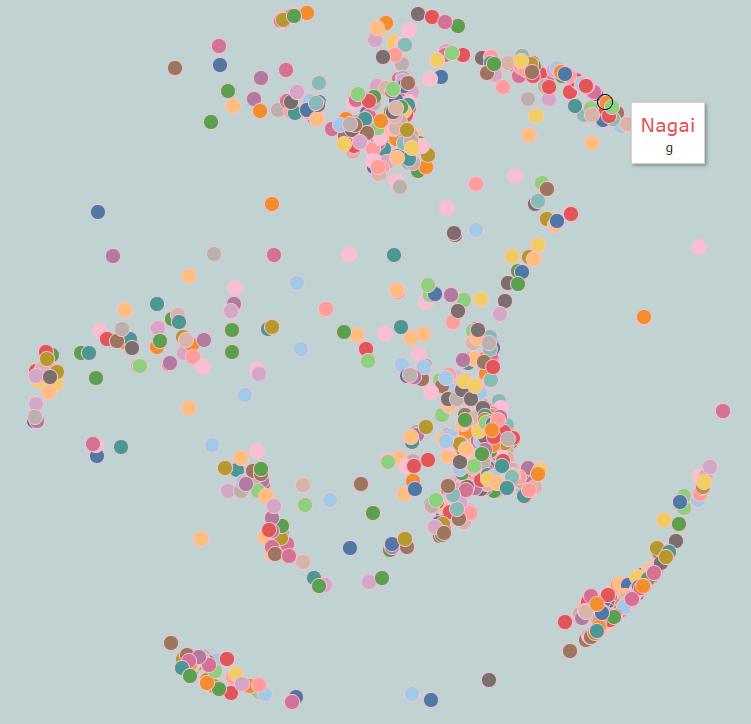
Points visualised on a sphere.
Adding Features from 2018.3
I then moved on to making a heat map and eventually created set actions to show percent of totals of user selections. This is shown in my final dashboard. See below.
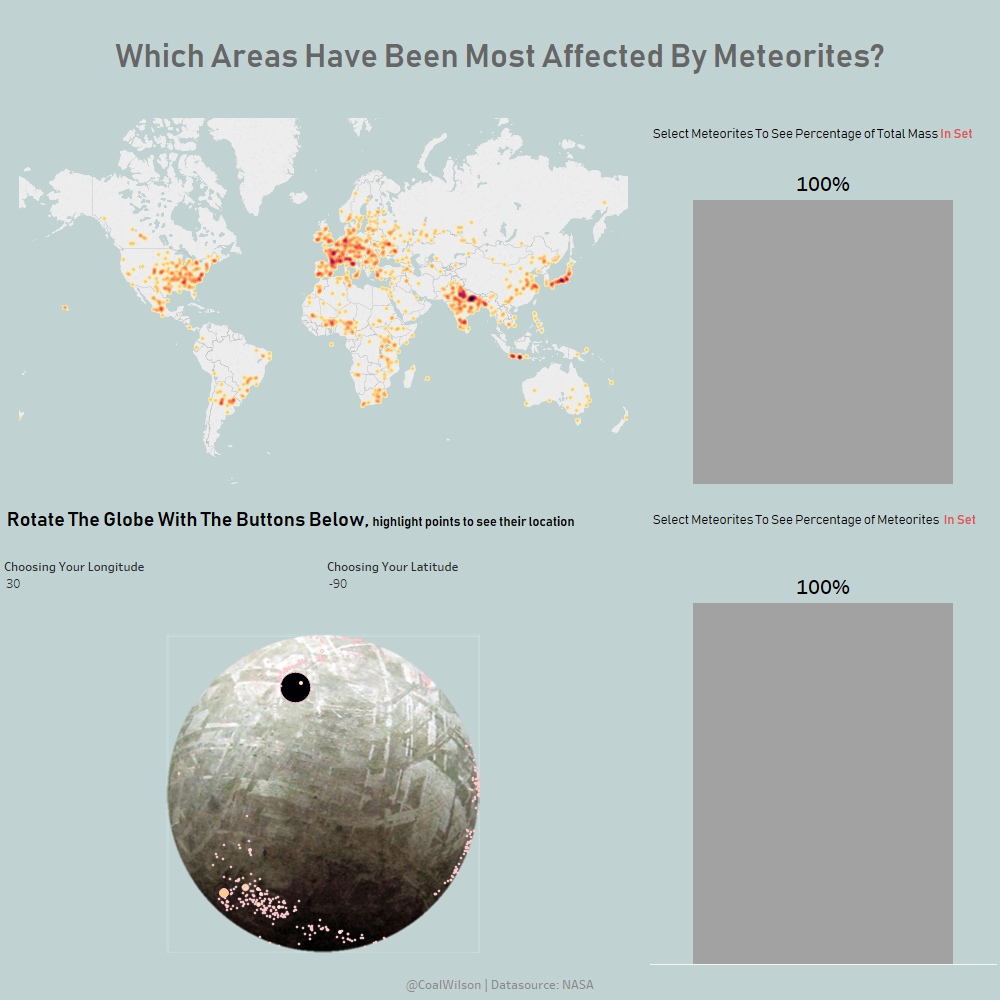
Final Dashboard