


Two API’s and App and A Dashboard
Today saw us creating an Alteryx app allowing a user to select locations and the bike docking data surrounding that location would be returned. The Alteryx app interface is shown below. The user can select a radius around 5 different locations. I was super original with my choice of streets… My final dashboard can be found here
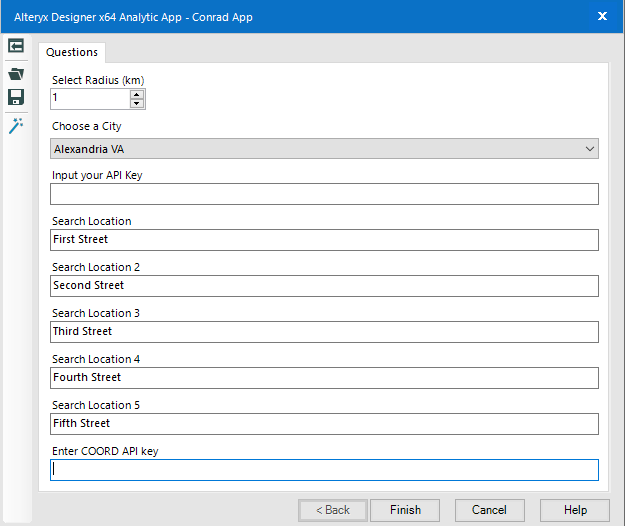
Figure 1. Alteryx App
The backend of the Alteryx app is shown below, it was not fun. First we used the google maps places API to return the longitude and latitude of the search locations. These longitudes and latitudes then fed into the coord bike share API to return the number of bike docking stations in the area. Once the app was completed a tableau workbook was automatically loaded with the final visualisation. This app was really interesting to produce but definitely caused a few headaches amongst the team.
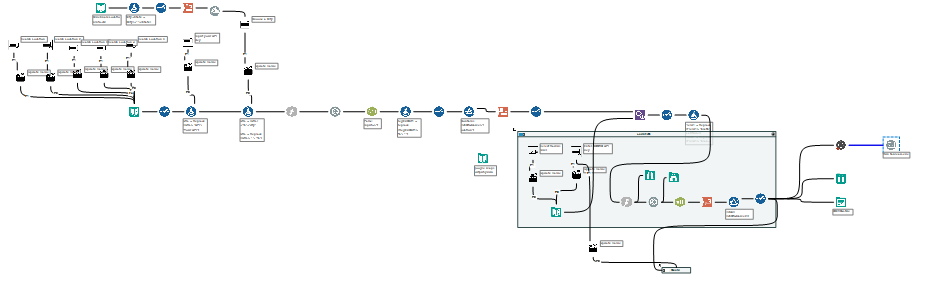
Figure 2. The Alteryx app workflow
The resulting dashboard looked as it does below. It shows data for five locations within Venice (California), left dashboard, and Philadelphia (Where Andy is from) right dashboard.
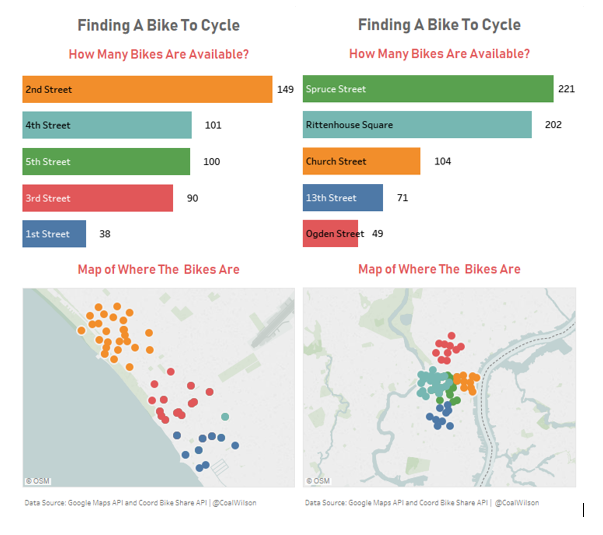
Figure 3. Final Dashboards