


Week 2 of The Data School (TDS) is over. Introduction to Alteryx, working with parameters and hello Tableau Server. Blown away with the spatial tools, thus this post.
I think it is fair to say that we all have been impressed with Alteryx. Complicated things seem easy(ier) now. We will be using it a lot to clean data, rearrange columns and, basically, preparing the input for Tableau. But, today, I want to go through three examples of using points (and latitude and longitude) into lines and how to use it afterwards. Some of the tools have already been discussed by my colleagues (in Giorgia’s first impressions, or in this combination of bus routes with income data by George) so I will be discussing only the tools needed for my workflow.
Example 1: What county borders does my selected flight cross? Or how to use spatial tools to create a flight path from individual GPS coordinates.
Let’s pretend that you either want to just obtain a flight path as a line object or that you are indeed interested in figuring out which counties you are flying over.
1. Create the line object:
First, we need to have the set of coordinates for the flight. You can probably obtain it from flight aware, ads-b exchange or your favourite GPS repository. For this example, I am going to use the British Airways flight from Edinburg to London Heathrow (link here). Ideally, you would be obtaining this information using your API of choice (see Jeremy’s post on using Alteryx to get data from API). I have uploaded the csv file in case you want to use it for your own test.
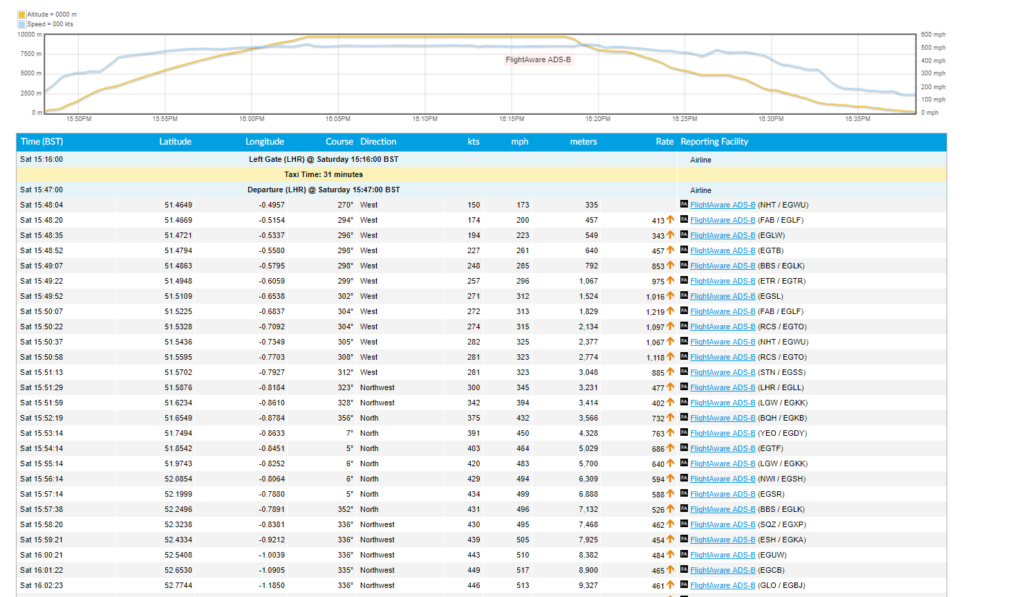
Click on the image to download the datasource for this flight example as csv
Once we have the GPS coordinates during the flight, we can launch Alteryx and use its variety of spatial tools.
We will have to follow a very simple pipeline:
- Read the data.
- Clean and transform the data.
- Add a recordId (sequential number) to use in the line creation (it will specify the order of the points).
- Create the points using Longitude and Latitude.
- Create the line using the points created in (4) and the order set in (3)
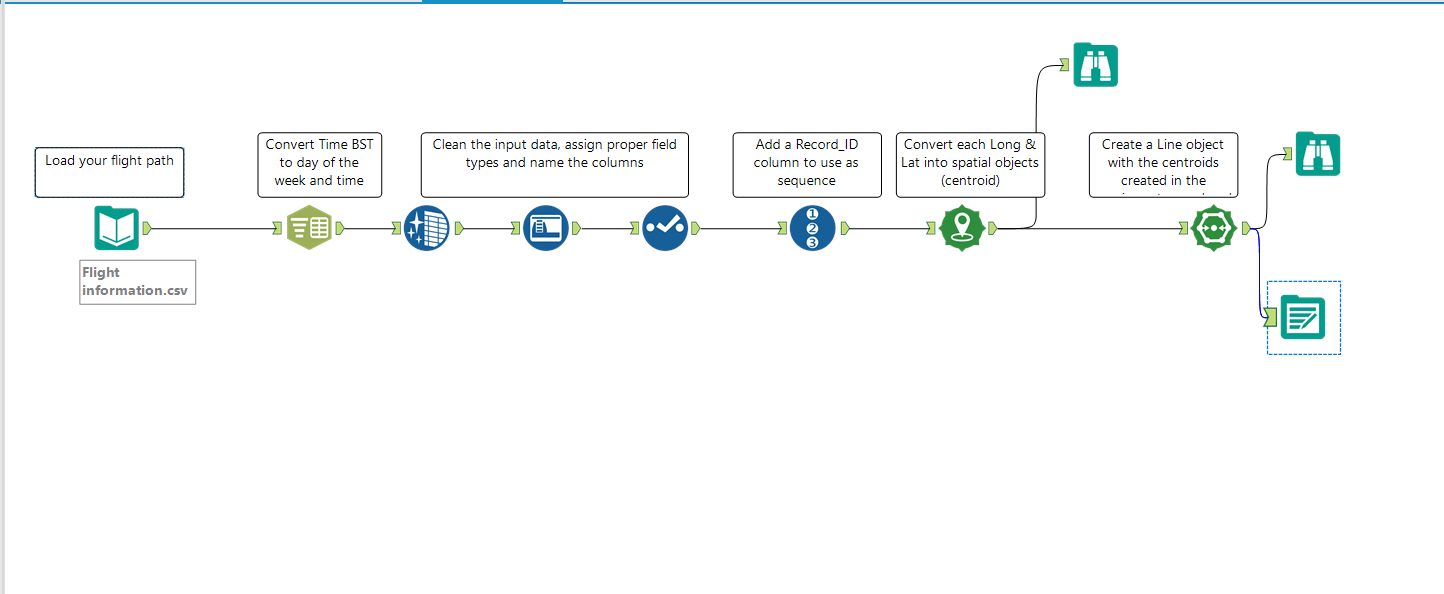
Click on the image to download the zipped workflow
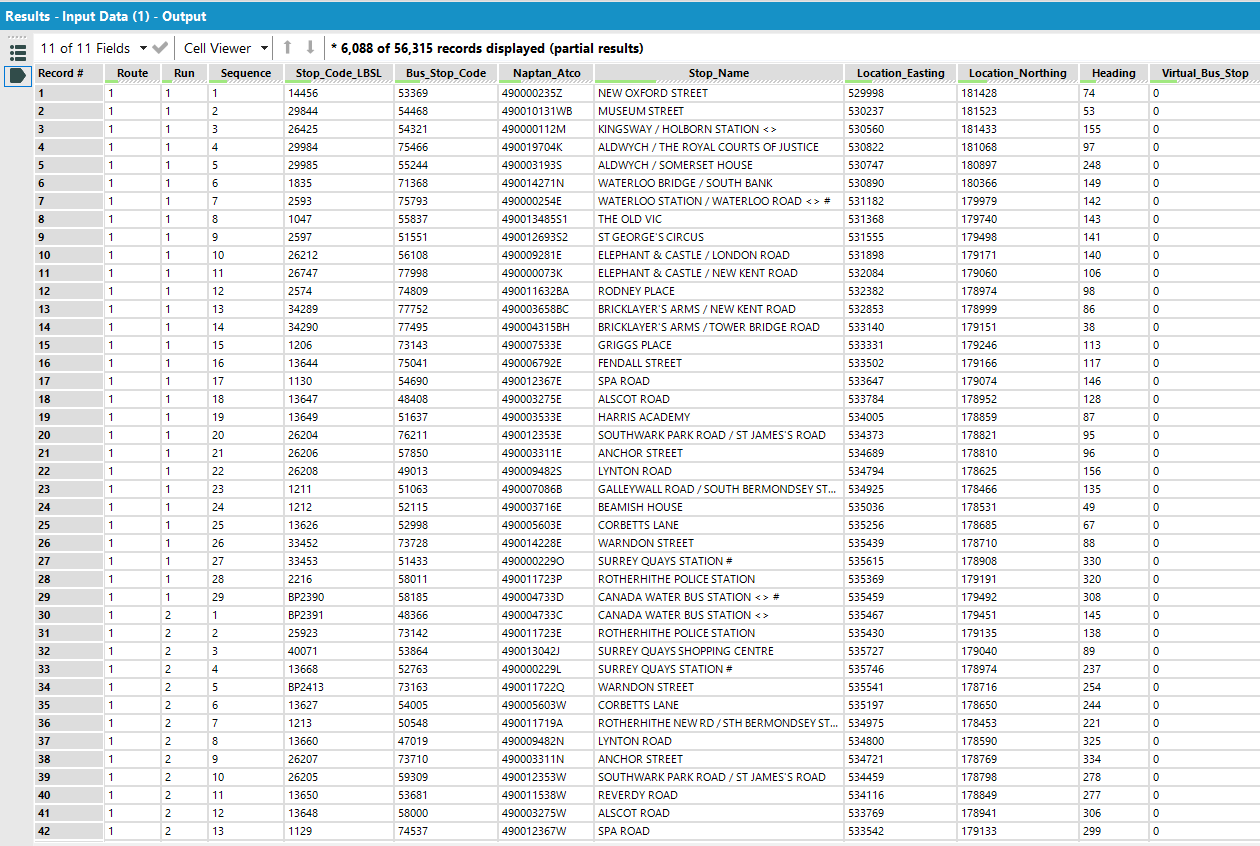
This is what the input data looks like after step 1: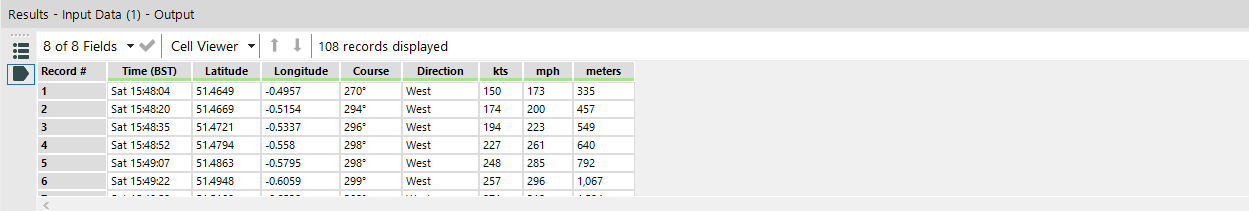
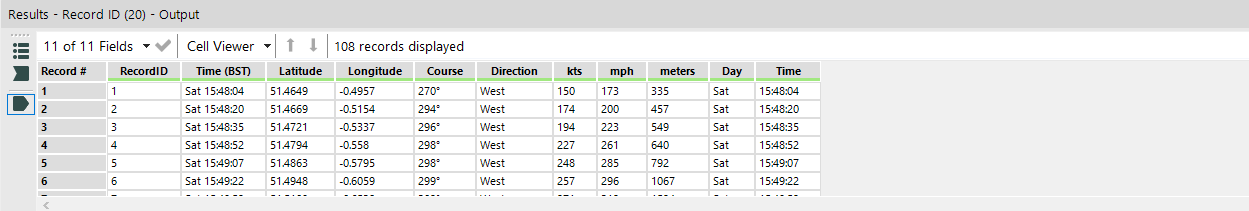
And this is how it looks immediately before step 4:
To configure the spatial tool to create points: choose Longitude and Latitude and assign the columns.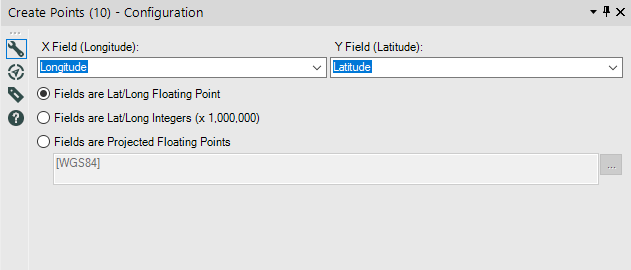
The table of that output should look like this:
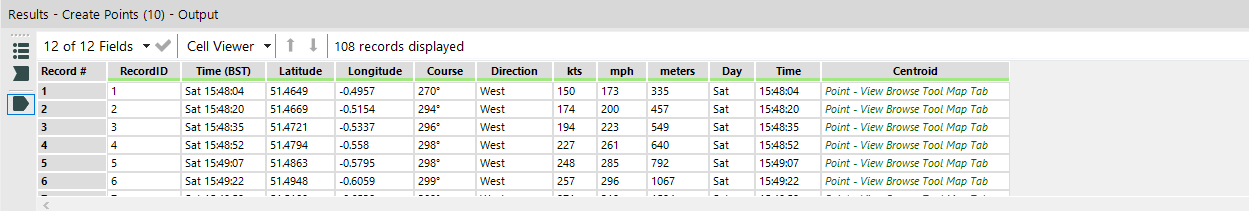
Which is the same table, with an additional column for the spatial object. Visualizing it with the browse tool will render:
This is ready for the last step using the poly-build tool configured for a line object:
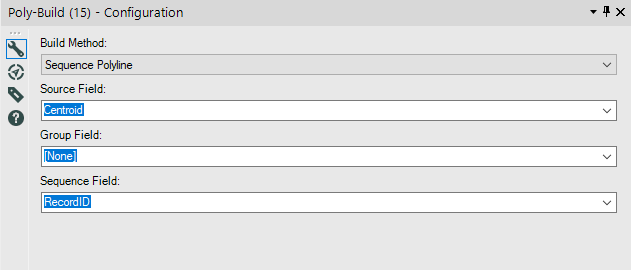
In this particular example, the option for “Sequence Field” could have been left blank and it would have still worked because Alteryx will use the order of the rows as a default. Alternatively, we could have used the “time” as our order and it would have, again, worked. A word of caution, though, for overnight flights, that would ruin the sequence – if possible, assign an explicit order for the sequence.
The outcome of this tool is a very condensed table:
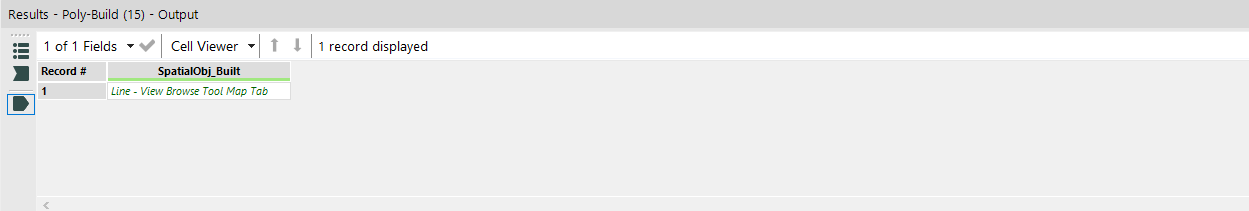
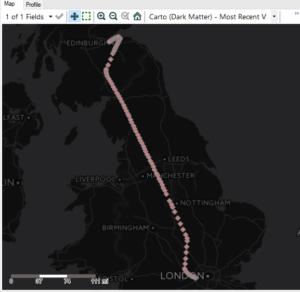
That can be visualized with the browse tool…
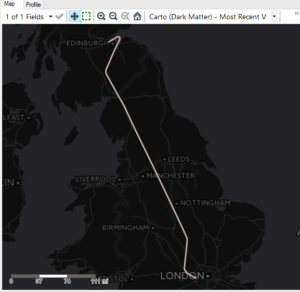
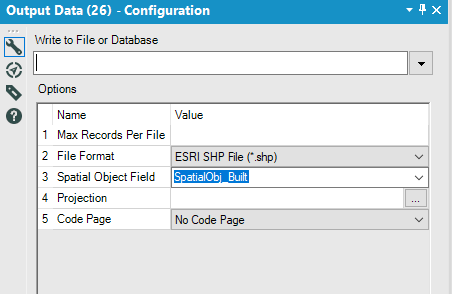
And exported as an ESRI shapefile that can then be used elsewhere.
2. Find which Ceremonial Counties are intersected by this flight path:
First, we need to obtain the shapefiles for the ceremonial counties (for instance, from data.gov.uk).
Now, we just need to load both shapefiles (the counties and the flight path created earlier) into a new workflow in Alteryx. Go to spatial tools and pick “Spatial Match” to find which polygons are intersected by the path. The output of the Spatial Match can be configured to include the intersection fragment. This yields just the part of the flight path that goes through the county as a separate line object.
After importing, I called the “Select Tool” to properly rename the columns containing the object. Then the Spatial Match configuration looks like this:
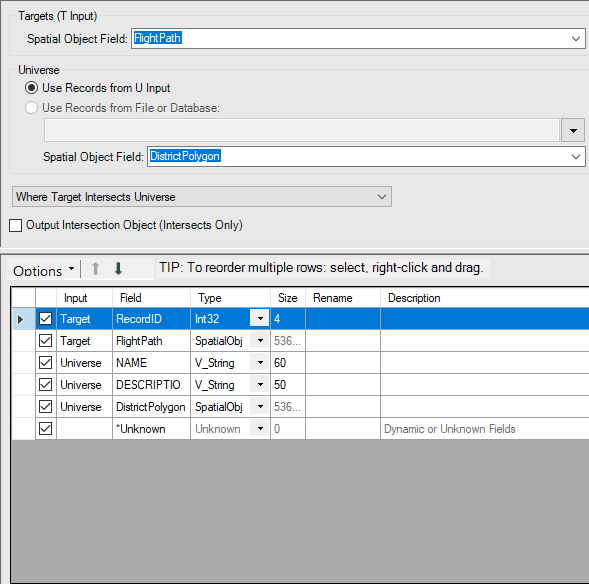
The output table contains, in each row, a county that is intersected by the flight path, and as spatial objects:
- A column with the fligh path (line).
- A column with the county region (polygon).
- A column with the fragment of the flight path within the county (line).
We can compare the different visualizations:
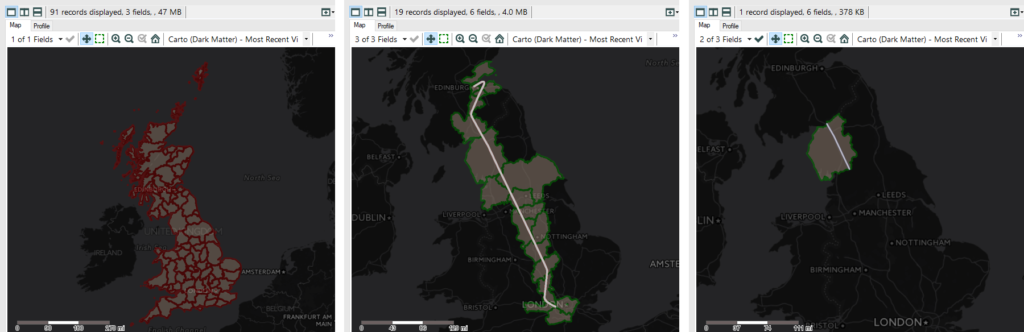
All ceremonial counties (red, left), those intersected by the flight (green, middle) and an example of the fragment of the flight path inside the polygon – County of Cumbria
Example 2: What are the bus routes in London? Or how to create multiple different lines from sets of individual GPS coordinates.
This is what we were actually playing around with this week (under Phillip Lowe’s guidance) and, if you go to Tableau Public, will find several different approaches in combination with other datasets (waiting times, income, speed, …).
The source file is a csv that contains all the lines in London, with all the runs (head and back) and all the stops (with the correspondent bus stop code, name, and location).
Click to maximize
The approach to convert all these stops into actual line objects is very similar to the one followed with the flight path above. The main differences are:
- Location here is given as Easting and Northing.
- The table contains multiple lines, many stops are shared among multiple lines.
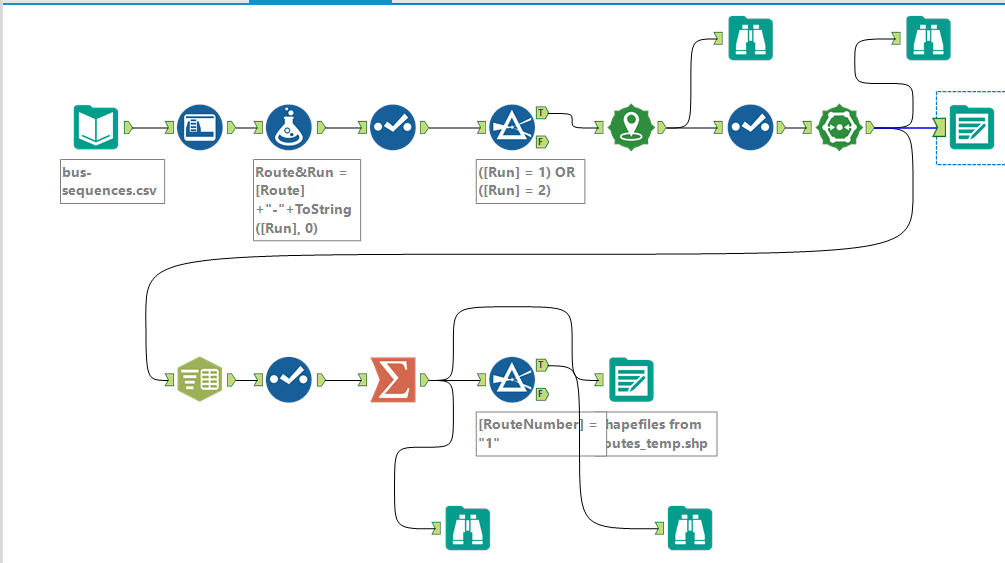
Sample Workflow with spatial tools and the summarize spatial feature
The workflow has some additional steps, but it begins with the same: clean the data, make sure the types are corrected, etc. Additionally, I included a filter step to keep only runs 1 and 2 of each line and then again into the spatial tools.
The point tool config is slightly different, to account for this different way of providing locations (kudos to Rob for his post on how to convert easting/northing into centroids in Alteryx)
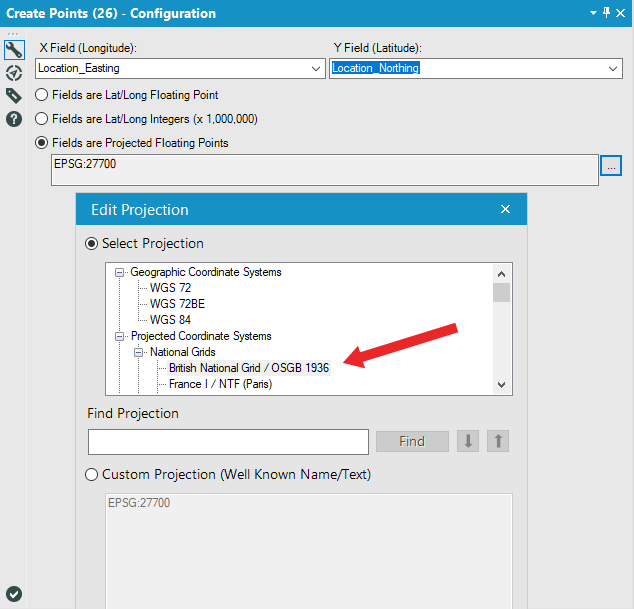
Create Point Configuration Using Easting/Northing projected onto the British National Grid
I used again the poly-build tool, this time using the options of grouping by (the column created during the prep phase that combines the line and the run), and using as sequence the column with the same name. #Tip: make sure that the type of that column is set correctly (i.e. Alteryx will provide different order for numbers and alphabetical: 1, 10, 2, 3, 31, 40 vs 1, 2, 3, 10, 31, 40).
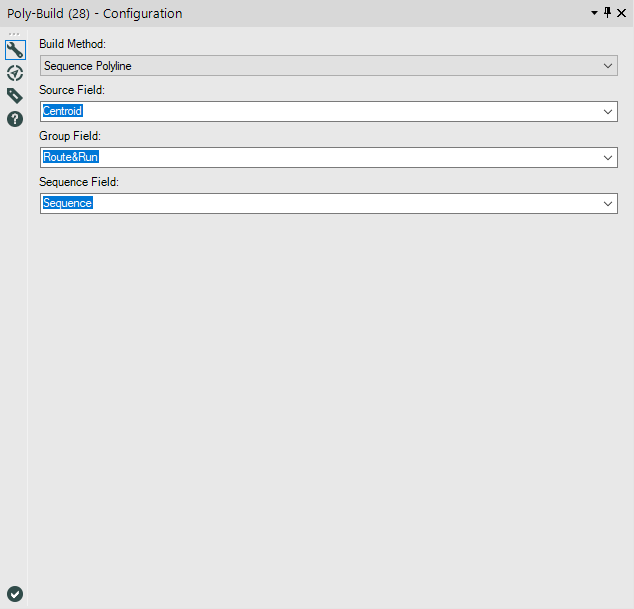
Poly-Build Config
The resulting shapefile can be immediately uploaded to Tableau and combined with other information, for instance, to know how busy your line combination is…
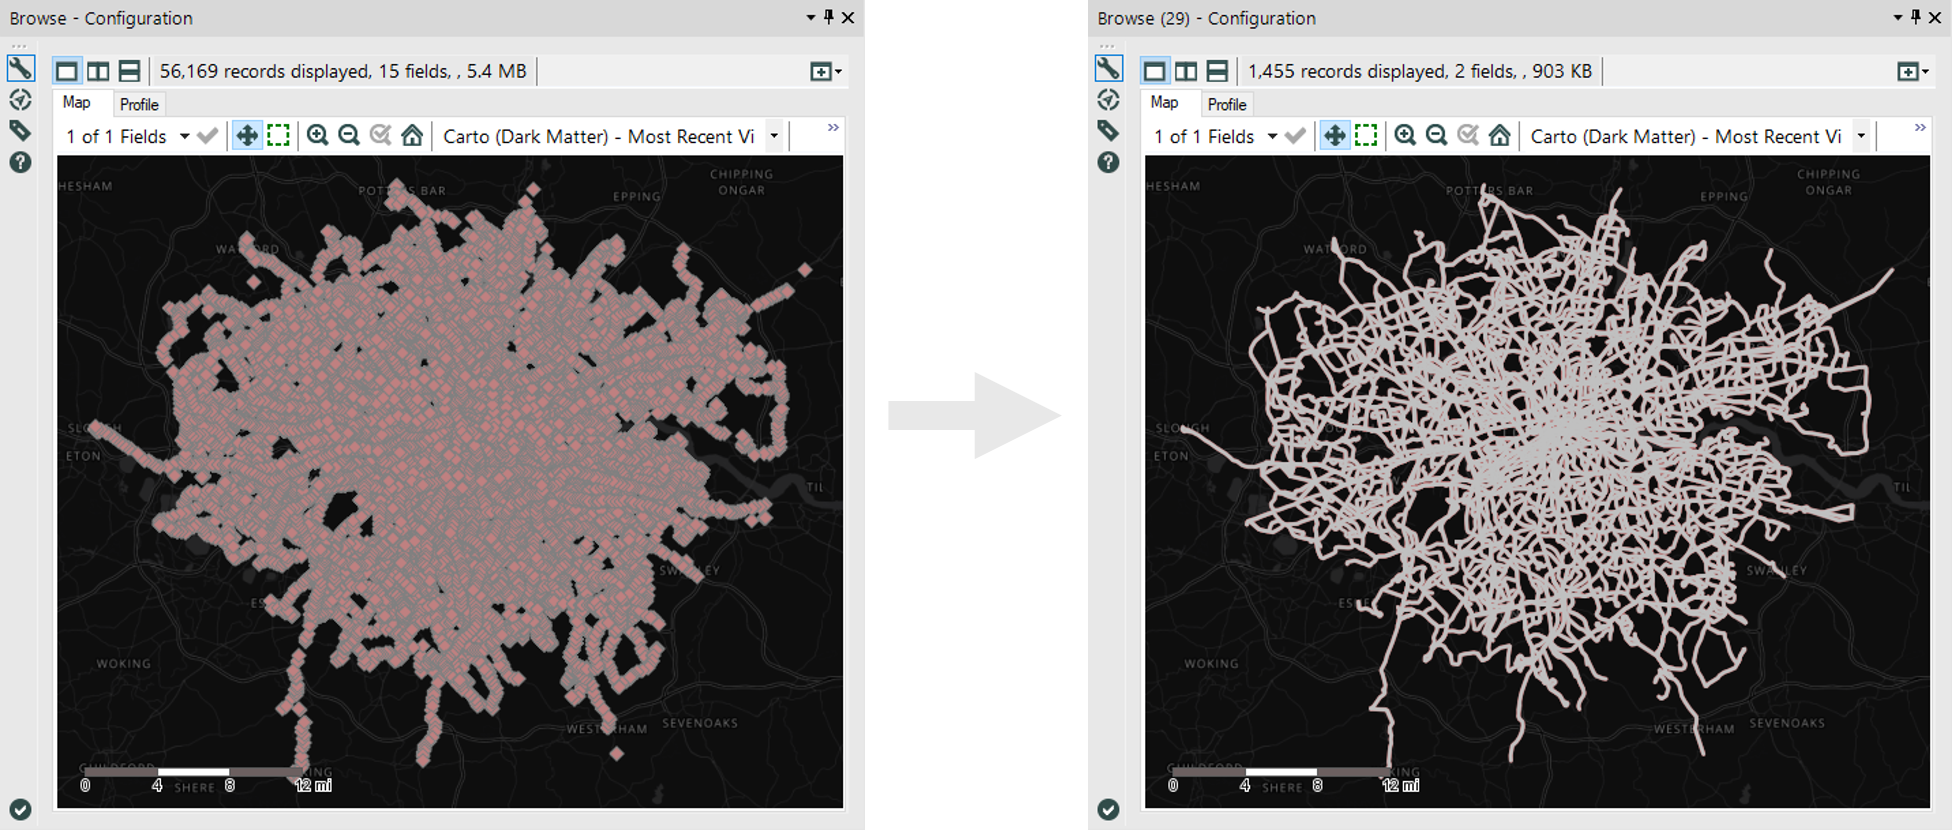
All bus stops as centroids (red, left) and converted into line objects using poly-build (white, right)
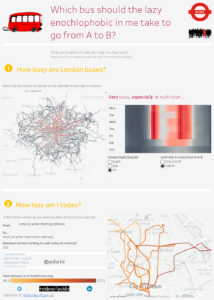
Example 3: What bus combination to take? Or how to create new lines based on input points and intersection of lines…
As a final example, let’s pretend for a second that we do not have access to google maps or the TfL website, and we still want to go from address A to address B using the bus, and we know that there is no direct connection. How to choose the combination of buses?
Here is my thought process:
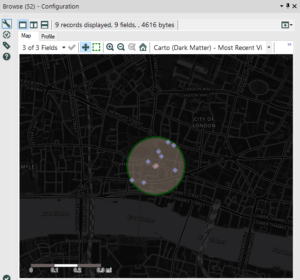
Stops within the ending area
- Define a distance that you are willing to walk from the starting address to the initial bus stop; this will define your starting area.
- Define a distance that you are willing to walk from the last bus stop to the destination address; this will define your ending area.
- Find all the bus routes going through all the stops within your starting area.
- Find all the bus routes going through all the stops within your ending area.
- If there is a route both in (3) and (4), then, problem solved, you have a direct route.
- If not: find all the stops from all the buses identified in (3). Find all the stops from all the buses identified in (4). Identify the common stops.
- Now we have a number of options that go as:
- Starting address – Starting stop – Line 1 – Transfer Stop – Line 2 – Ending Stop – Ending address.
- The difficult part is now to generate the appropriate line objects using Alteryx. Below is my approach. It’s not pretty. But, hey, just 2 days using Alteryx!

Workflow to split lines and recombine based on intersection with origin area, final area and intersection of the lines
A snapshot of the result:
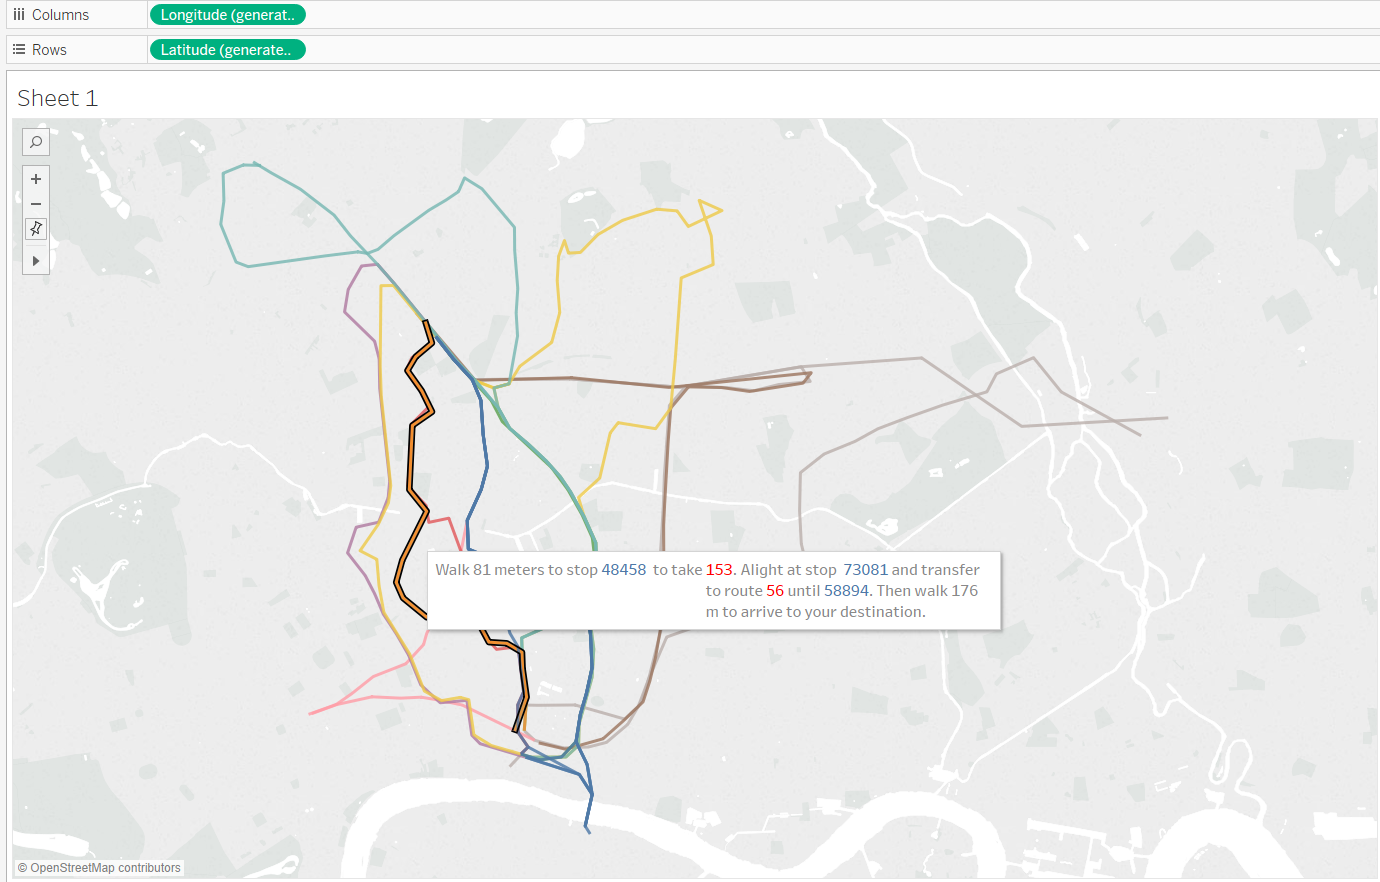
To see the result of this manipulation in Tableau…
Dashboard of the project for Week 2
Quite easy to use once you start playing around with it. Online help is succinct, but so far, sufficient. I referred to it while trying to figure out why my spatial match was not working (tip: When working with Polygons and Points – Configure with the Polygon on the Targets side)
I am looking forward to continue using Alteryx in the upcoming weeks.
If you have any comments, please leave them here or find me on twitter.