


While I use Tableau in my professional life here at the Data School New York, my colleague at Fullstack Academy, Ronisha Harvey, employs PowerBI. After expressing interest to her about learning PowerBI, she suggested Dashboard in a Day Power BI Training. Since I am still on bench, I signed up for a training session and here are my thoughts.
PowerBI reminds me of Excel and other Microsoft Office products - it’s a very familiar environment to me, but I do not yet know where tools are located, especially among all the tabs and panes.
After introducing the Microsoft Power Platform, completing a Kahoot icebreaker activity, and opening PowerBI, the trainers reviewed the interface and at a high level, touched upon the following processes:
1. Data Discovery
2. Data Modeling
3. Data Visualization
4. Data Sharing
This lecture concluded with a demonstration of connecting to data and then we were directed to complete the first lab. The first lab was about accessing and preparing data. Unlike Tableau Desktop, PowerBI has built-in data preparation tools. In the Power Query Editor window, users can choose and remove columns and rows, split columns, transpose, and more. The data cleaning tools in PowerBI are definitely more extensive than in Excel.

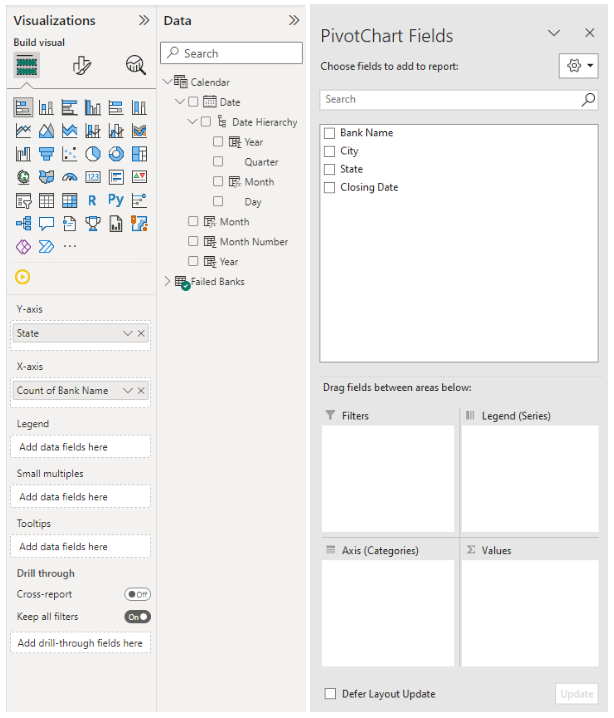
After the first lab, we returned to the first workbook and practiced data modeling and used DAX (Data Analysis eXpression) language to create a calculated table, calculated columns, and a calculated measure. The formula bar below the ribbon for DAX is reminiscent of Excel and the spaces to drag fields into in the Visualizations pane awakened my (fond) memories of Excel pivot tables.
We also practiced creating hierarchies to drill down in PowerBI. Although it is easy to design hierarchies in the Data pane, it is confusing to use them in the visualization.There are a series of drill down icons in the top right corner of a visualization. The first one makes sense - it’s to drill up. Then there is a set of three icons pointing down. The single arrow pointing down is to turn on drill down, the double arrows pointing down is to go to the next level in the hierarchy, and the last icon is to expand all down one level in the hierarchy. As a new user of PowerBI, I never know which down arrow to click.

The second lab was on data modeling and exploration (through visualization). Like in Tableau, there are multiple ways of doing the same thing in PowerBI. Data modeling can be organized in the Model view, but it can also be done in the ribbon: Modeling > Manage relationships. There are relationships between tables in PowerBI, like there are in Tableau, but there doesn’t seem to be a differentiation between logical tables (of relationships) and physical tables (of unions and/or joins).

The next demonstration was on interactivity, such as filter actions, highlight actions, and tooltips, as well as formatting. I do not know if there are set actions and parameter actions in PowerBI, but a strength of PowerBI is the ease of adding interactivity. Another thing I like about PowerBI is the ability to round corners in individual visuals. This is a feature I wish Tableau had because I like that look of rounded rectangles!
The third lab was focused on data visualization. I strayed from the given directions and just played around with the visualization and formatting options. This is my first PowerBI dashboard; I don’t love it, but it’s what I made in the given time.

The last demonstration was on data publishing and sharing. We examined the workspace, where users can store reports, datasets, dashboard, workbooks, and data flows. We concluded the training by going through the process of making an app and scheduling data refreshes.
Do I recommend Dashboard in a Day Power BI Training?
For new users, yes.
For a Data School-trained Tableau/Alteryx Consultant, like me, the pacing felt a little slow. I enjoyed the independent labs the most because I could explore and go at my desired pace of learning. Nevertheless, I feel more familiar with PowerBI and feel better equipped to attempt a Dashboard Week: PowerBI day soon! Stay tuned for that.