


Day four’s challenge was back in Tableau – analysing count of cyclists from Seattle’s Open Gov data. Over the past four or five years Seattle have implemented counters to track the number of cyclists over time in various parts of the city. This is because there are new cycle lanes and trails over Seattle in the attempt to reduce traffic and therefore pollution across Seattle.
My Approach
This seemed relatively nice, and we all got started downloading the data from 12 different counters. The prep and joins were performed in Alteryx, though we soon realised that the counters had no location data. I used the counter name and looked across google maps and the map they gave to find out roughly where these were located.
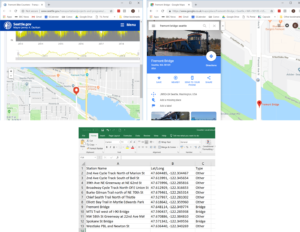
Using the data website and Google Maps to roughly locate the counter locations
Accidentally too wide
Once the data was sorted I made the mistake of trying to go too wide with it. Today was definitely a lesson in deciding what to focus on earlier than 2 hours before the deadline!
- Initially I’d found Collisions data which detailed the number of cycle and pedestrian accidents in seattle but there was no trend within the data over time
- I downloaded some weather data from Seattles’ roads but soon realised that the relationship between cyclists and weather was almost too obvious and interlinked with the seasonality in the data to build a story
- My second last decision was to look at a few companies in Seattle and see if there were stations close enough near by to identify when the best time to commute would be. I decided on Tableau, Amazon and Starbucks, but quickly realised that the counter locations were too far away and not frequently dispersed enough to accurately determine this!
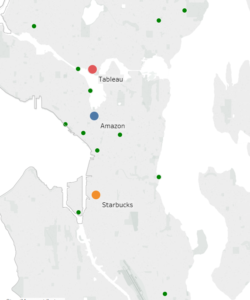
Bike Counters and Company Locations
Final narrowing down
I finally decided to still take the commuter viewpoint but instead focus on the three bridges and commuting into the city.
I created some calendar heat maps, line charts and BANs (Big Ass Numbers) to really bring how how high the contrast is during the commuting hours over the bridges! Have a visit and place with the time and bridge filters – let me know what you think!
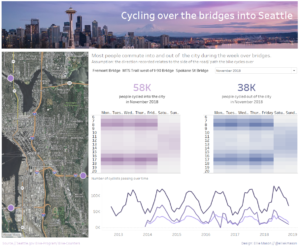
My Final Viz!