This is the latest post in my Statistics Series. In the series so far I’ve shown how to generate clusters in both Alteryx and Tableau and I will now talk about Time Series analysis, Time Series forecasting and how to perform it in Alteryx.
Time Series Analysis and Time Series Forecasting
Time Series analysis uses different methods for analysing data that is in date order; a temporal analysis of data. It extracts meaningful characteristics and statistics, to help forecast various situations from previously ‘observed’ values – i.e. from the data set provided: Time Series Forecasting.
Good forecasts capture well the characteristics of the previous values, without actually reproducing specific events that happened. An example of this is a model that forecasting the housing market – a good one will accurately forecast dips and peaks, but will not replicate the 2007/ 2008 event in the same way that it happened before. Catching and forecasting the signal in a data set, not the noise.
In Alteryx
In Alteryx the Time Series tools are in all orange and incorporate R scripting language to perform the analysis in the background of the user-interface.

Alteryx Time Series Analysis Tools
In the example below I work through how to use time series analysis to look at future demand for a specific type of medication using 2016 prescription data and the number of prescriptions given out each month. This will help identify if demand will increase and therefore an organisation can plan for it.
Step One: Data prep
Often when performing statistics, it’s best practice to get the data in the ‘right’ order and format. For time series analysis this includes:
- Checking variable types and names, often they need to be numerical
- Summarising to have just one entry per time, this is neater and quicker if working with big data sets
- Sort to have the dates in the right order
- As with any statistical test – be aware of missing values! The data must be collected for the dates in the data, anything missing will cause the model to not work as the dates have to be sequential
Step Two: Plot the data
Plotting the date data enables any gaps to be found. These can then be filled in as the data needs to be in sequential order (data scaffolding). This is performed using the ‘TS Filler’ time series tool. In the configuration window, specify the date field, the type of date and the step it takes, e.g. one month, one day, one hour, etc.
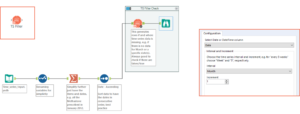
Prep the data and then check the sequential order of the date field using the Filler Tool
The tool essentially looks at the ordered dates and identifies any gaps, marking them as ‘True’. This allows you to fill in the gaps, using a multi-formula tool to fill down from any true values in the flag field. Often a moving average for that decade/ time period is used as a proxy. In the prescriptions data the dates were all consecutive so I could move onto holding out some of the sample.
Step Three: Hold out sample
Sample if often split out into two or three parts before using some statistical tests, especially when creating/ using models. This is because some of the original data set that has not been used to build the model is needed to validate the model, i.e. a test of accuracy. When using other statistical models, the sample tool is used as it takes samples by random. However, for time series analysis this is created using a filter tool.
Before holding out the sample, a record ID is added to allow for sequential holding out of the data. This is because the models need the data to be in sequential date order so we can’t take a random order. This also helps within the filter tool, as we can filter out the last 6 months of data/ last 6 rows, by using the record ID. In the prescription data there is 64 rows, so we need to separate out those with a RecordID less than 59.

Creating the hold out sample using the RecordID and Filter tools
Step Four: use the two models
Once we have the data in sequential order, with a subset saved for validation later, we can then feed the data through the two model tools: ARIMA and ETS.

ARIMA and ETS Time Series Analysis Modelling Tools
ARIMA
This uses an auto-regressive, integrated moving average method to estimate the time series forecasting model. The ARIMA model tests the historical observations and forecasts it. The ARIMA model can also add a regression component, to see if any other variables help forecast future values of the target. For example in this case, if the stock of a drug or weather influences the number of items prescribed (the target). But here, just the number of items prescribed is being tested so therefore this is not used.
Note that when configuring this tool, it will always auto chose RecordID as target when it’s actually the numerical field (here Sum_Items) that we want. It’s also often good to specify how far we want the model to try and forecast into the future, as this will be tested against in the model comparison tool. In the configuration window go to ‘Other options’ tab to tick and specify the year and how many months/time series that we’ve included (6 as have taken out 6 from the original data).
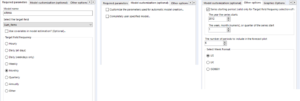
Configuration tabs for the ARIMA model
ETS
This uses an exponential smoothing method to estimate the time series forecasting model. The ETS model values the more recent observations a lot more than ones further away in time. It only uses the variable’s observations, unlike in ARIMA where multiple variables can be added in as part of a regression component as well as the observation data.
Sometimes, it can result in a flat line forecast due to only taking the last few observations into account, which leads to more anomalous results that anything more historical. However, we can tell the model to take into account the historical ones a little more. Within ETS in the Model type configuration tab we can specify Error, trend type, trend dampening and seasonal type (additive or multiplicative seasonality – see here for a great explanation and exercise).
Similarly to the ARIMA model tool, check the target isn’t RecordID but the field, specify the starting period and the start of the time series (e.g. 2012, January), as well as how many have been included (6 as taken out 6 from starting sample).
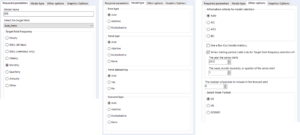
Configuration tabs for ETS model tool
Run the models. Don’t forget to name the models in their configuration windows so there’s no confusion when comparing them later on.
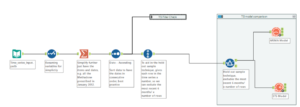
The Models in the workflow
Step Five: compare/ test the models
Union the two model outputs together, and join this with the validation sample, held back earlier, within the TS Compare model comparison tool.

TS Compare tool
Using the TS compare tool, find out which model is the most accurate. This tool compares the model outputs against the actual ‘future’ – i.e. the 6 months of data that was taken out during the sample hold out earlier. This tool doesn’t need any configuration.
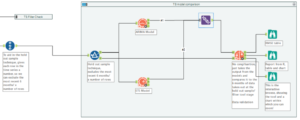
Join the two model outputs together and link that, along with the ‘last’ 6 months of data for model validation
The output of the model comparison tool shows the actual plotted data as well as the two forecasts from each model within a line graph. This is handy as you can validate the models easily by seeing which more closely matched the actual line observed. The Root Mean Square Error (RMSE) is also outputted, which can be used to check which line is numerically better (i.e. lowest error), rather than just visually. The model with the lowest RMSE is the more accurate.
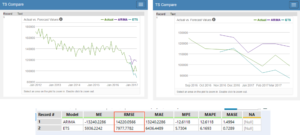
TS Compare results – showing that the ETS tool is more accurate
In this case, the ETS model is the better model, as it both visually looks and numerically indicates a higher accuracy.
Step Six – Run the model
The final step is to run all of the data through the most accurate model, and then run that output through the TS Forecast tool.

TS forecast tool, taking the chosen model’s forecast
In the configuration window, name the forecast field, add confidence intervals (the default for this is 95% (equating to 0.05) and 80%) and the number of periods to forecast in the future. The periods will match the periods in the data set, e.g. 1 month or 1 day.
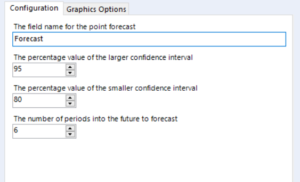
TS Forecast tool configuration window
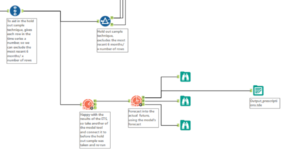
Workflow running the final model and forecast tool; outputting the data
The forecast tool outputs a static graph, data in a table and an interactive graph which ‘zooms’ in over selected time periods. The data can then be outputted to either excel or as a Tableau .tde file. The outputs here, indicate that the prescribing of this medicine will most likely decrease in the future, but could remain stable.
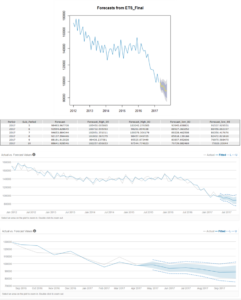
Static graph, table and interactive graphs outputted from the TS Forecast tool
I hope you found this useful – look out for the other articles in my statistics series here! Here’s a link to learn how to perform Classification.
