When building a dashboard not always we want to show all the data for all the months or days available in our dataset.
Let’s say that we have a time series based in a table calculation that we are interested in showing, something like a running total, YTD total or difference from last month, however we only want to show the latest month.
We may start with something like: year, month, sum of sales, monthly difference in sales and running total.
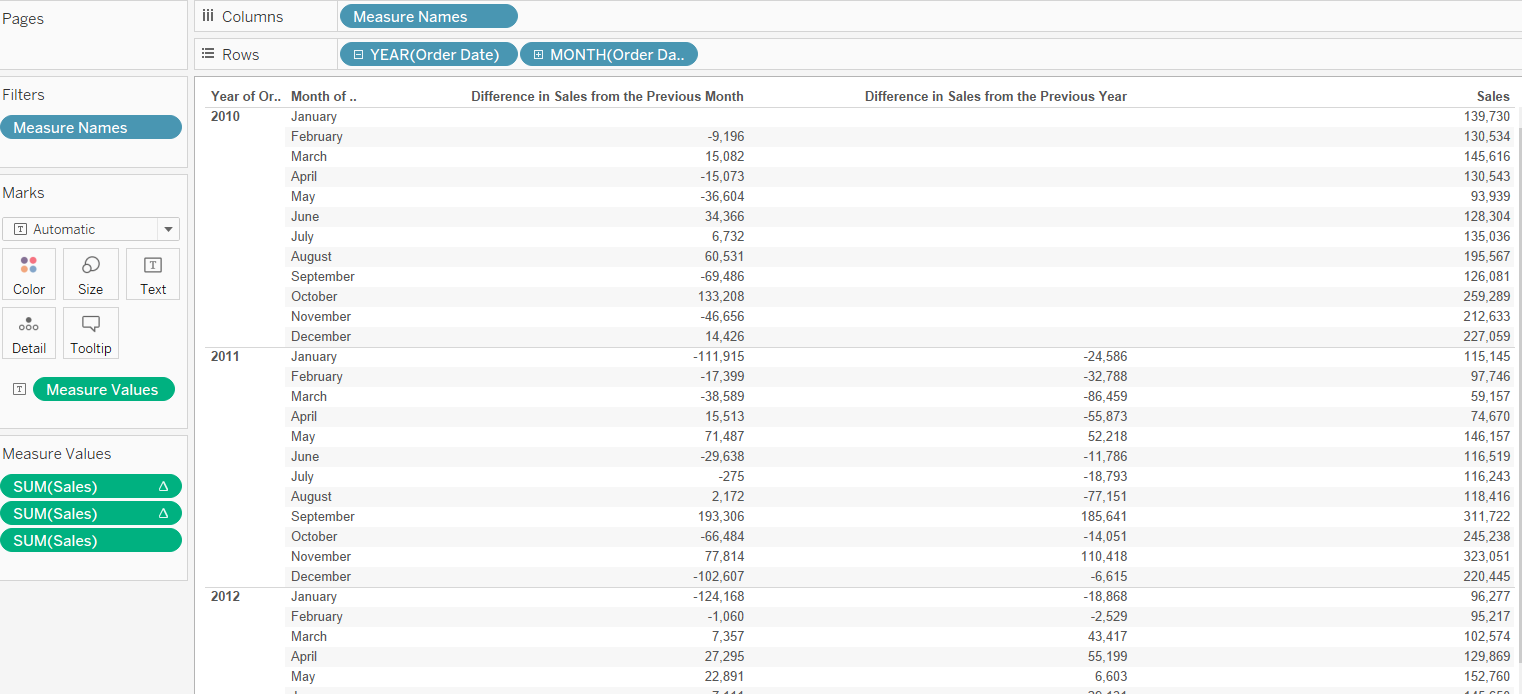
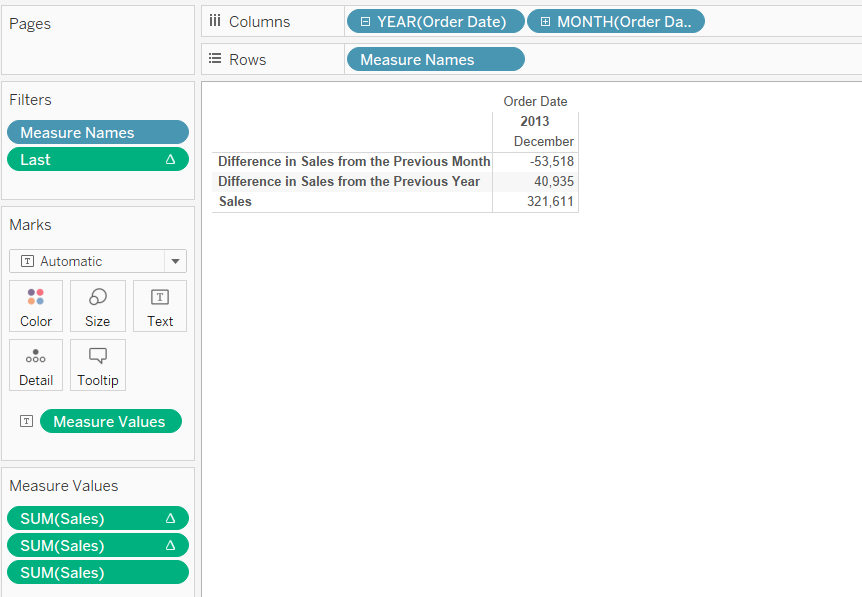
But our intention is to only show the latest month, in this case December 2013.
The first thing to do is to create calculated field using the ‘last’ function, as below:
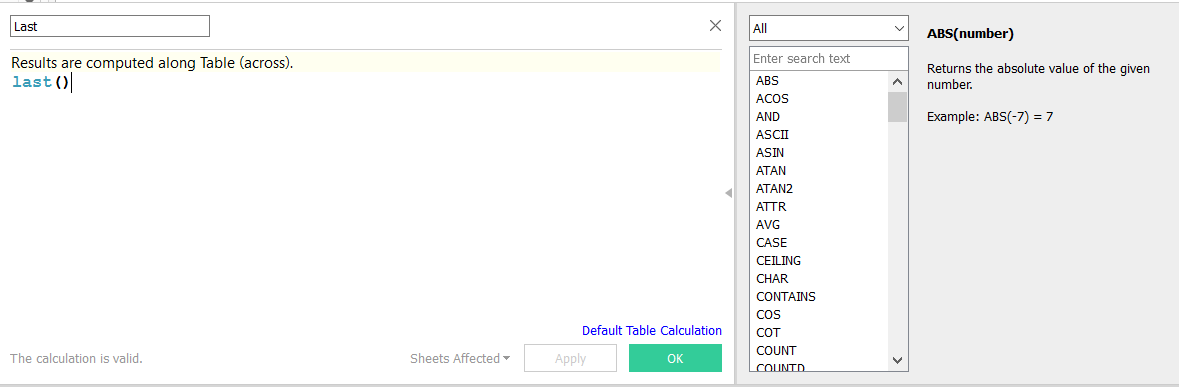
And then we place the recently created calculated field in the filters shelf. This way we will always have the last month of data, even if further months are added to our data source.