


Today we were tasked with PDF scraping!
The data we had to analyse came from Harvard Dataverse looking at rural electricity demand in India. Our task was to scrape the PDF of the original questionnaire to retrieve the question headers, and then then to join them back in to the answers spreadsheet.
I original started by trying the scrape the PDF in Tableau Prep, but then decided to have a go in Alteryx which in this case proved to be easier.
Here is a view of my finished workflow.
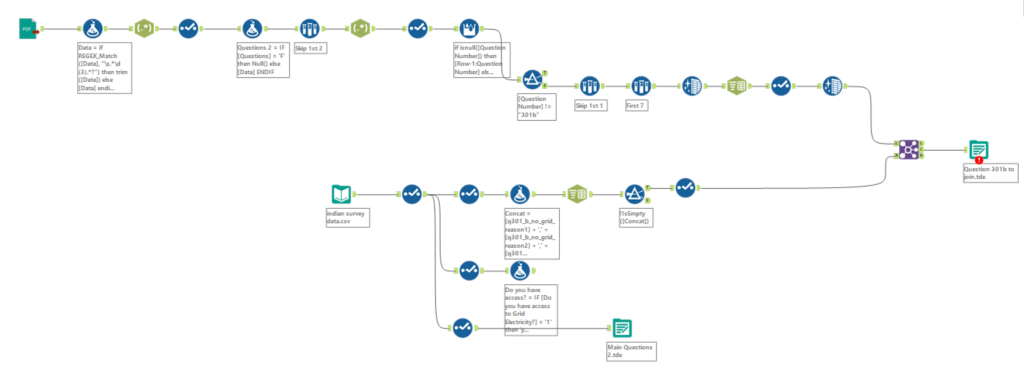
In the end I decided to filter out just the questions that I was interested in using in my final dashboard. I then took out the questions that had the option for the respondent to give multiple answers, and created separate question tables which I would then join back into my main dataset in Tableau using the household ID. In the end however, I didn’t end up using any if these particular questions, but it was a good learning experience!
For my final dashboard I wanted to look at annual household income vs electricity grid access. Originally, I wanted to do a drilldown from region to district but for some reason I just couldn’t get this to work on the map (after getting help from multiple DSers and getting nowhere, I decided to settle on using a drilldown bar chart instead (any ideas on why this wouldn’t work in Tableau would be appreciated!)
Here is a view of the final dashboard:
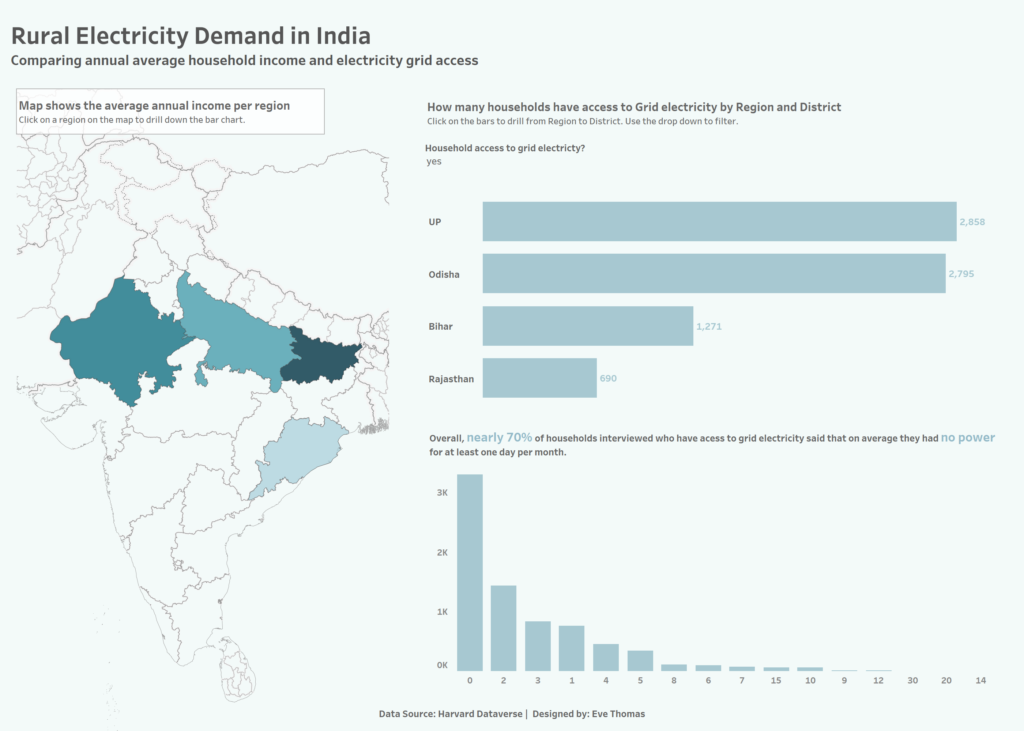
Over-all I am pretty happy with how the viz turned out despite the drill down not playing ball. It is something that I hope to address during the feedback session tomorrow!