Last week I wrote a blog post on how to create a density map using Alteryx (find it here). However, if you don’t have Alteryx to hand or you just want to improve your Tableau skills then here is an alternative way to make a density map in Tableau using hexbins.
To create a hexbin map in Tableau we will need to have a dataset that contains latitude and longitude coordinates. For this example I am using NY Rats Sightings Data (#MakeoverMonday 2018 W27) which can be found here.
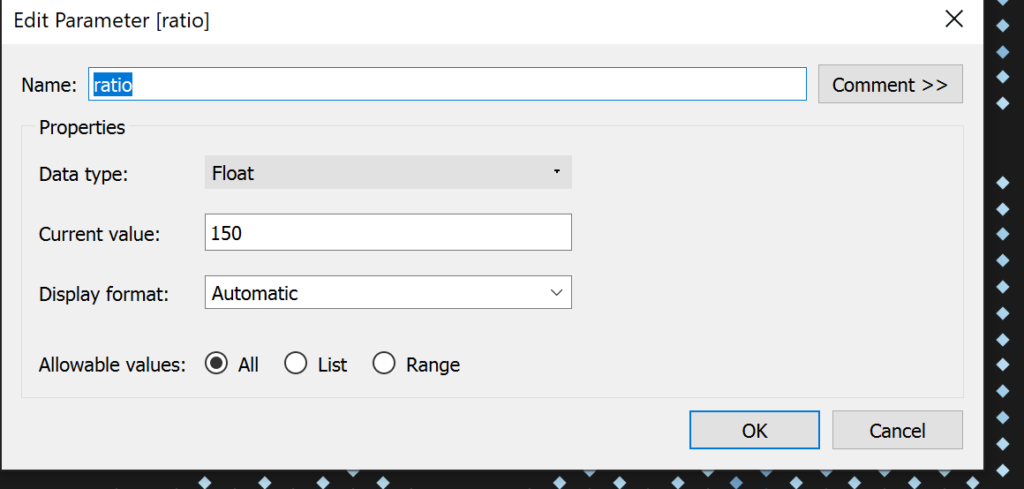
The first stage in creating our hexbin map is to create a ratio parameter – the parameter value will determine the number of hexbins in the view. I have created my parameter as data type ‘float’, with display format set to ‘automatic’ and allowable values set to ‘All’. For this example, I have the value set at 150. See image below:

Our next step is to write our calculations for our hexbin measures for latitude and longitude.
For HEXX:

For HEXY:

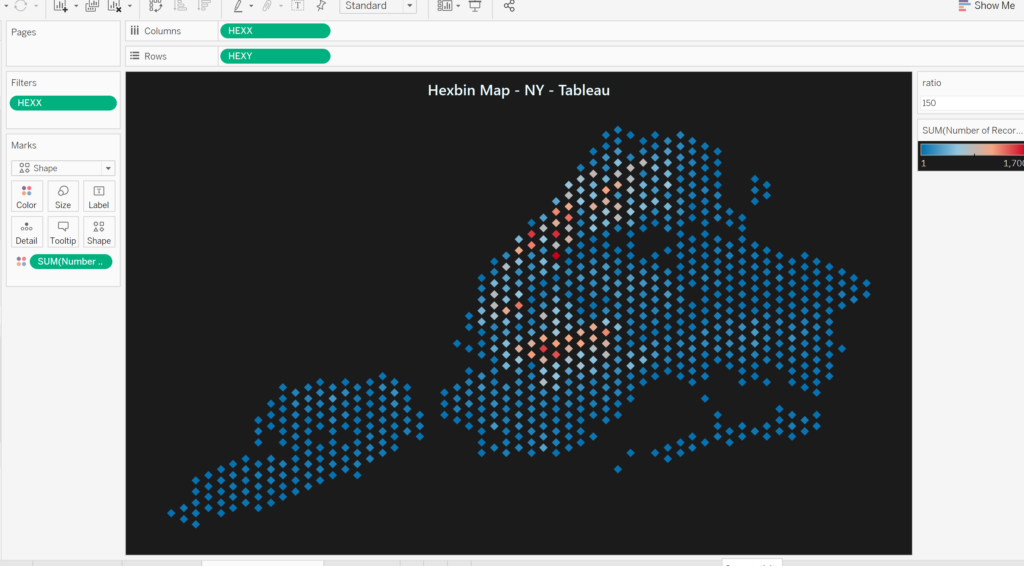
Once we’ve created our HEXX and HEXY measures, we need to drag them into the view. Drag HEXX to columns and HEXY to rows. Make sure that both measures are set to ‘continuous’ and ‘dimension’.
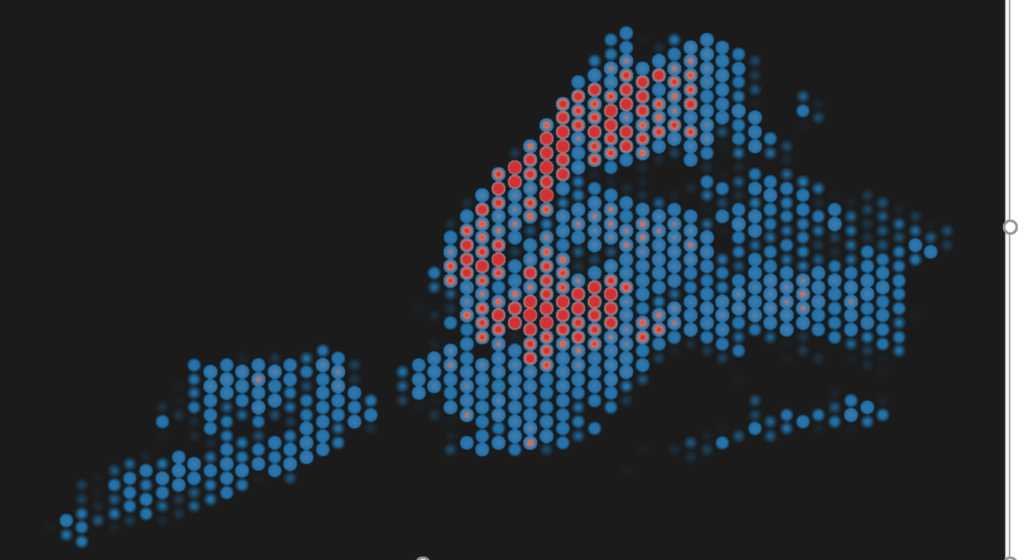
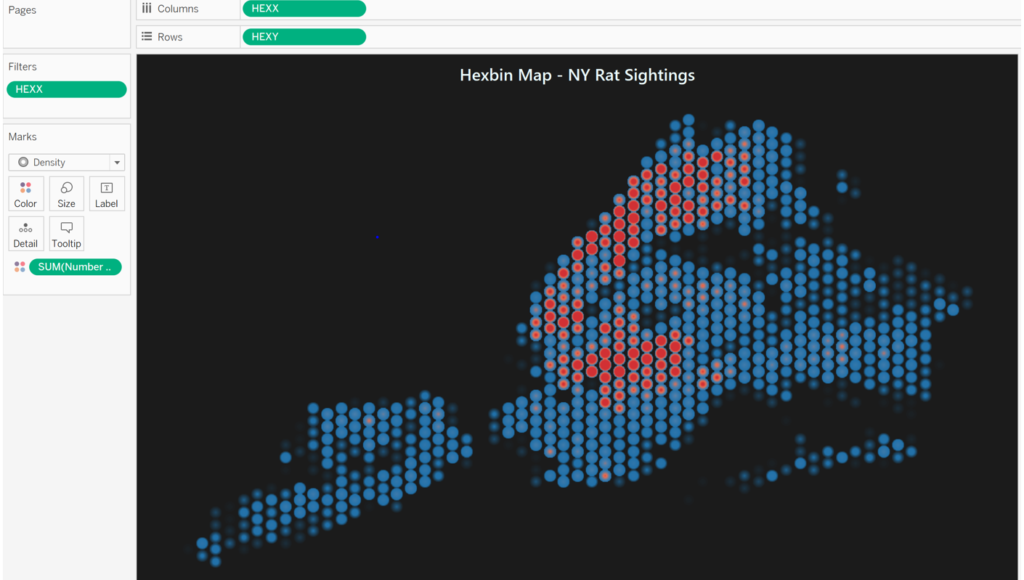
Once we are at this this point we can have some fun designing our hexbin maps! Here are two different examples that I came up with:
In the first example, I have dragged the measure I’m counting (in this case no. of rat sightings) onto shape on the marks card and I have chosen to use a diamond shape (personally I like the way the bins slot together with diamonds but squares and circles would also work well!)

In the second example I have used the same colour palette but instead of selecting ‘shape’ I have selected ‘density’ on the drop down in the marks card.

And that is all there is to it. Please feel free to download the step by step work book here.
Have fun Tableau-ing peeps!!
