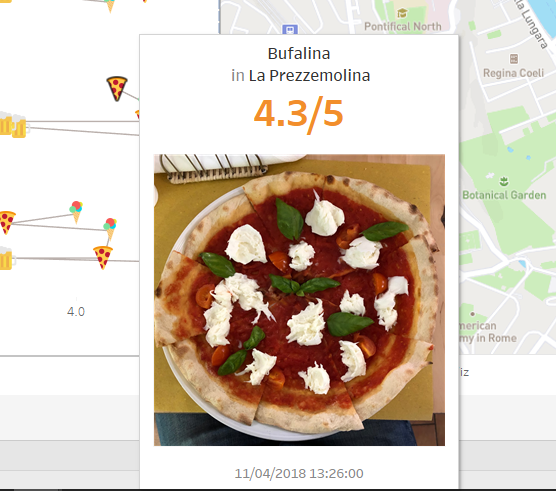
Day 1 from dashboard week is over! What a day, after being blocked from a the website we were tasked to scrape, because of too many simultaneous requests, Andy gave us an alternative task in the afternoon. Analyzing his consumption of pizza, gelato and beer during his last trip to Rome..!
So here we go, I have put together a dashboard showing that. Along the way, I learned a useful little trip, using shapes to display images in tooltips.
1. Download the images you want to use and store them somewhere you can easily access
2. Create a dummy scatter plot
Type 1 in the columns, 1 in the row. Fix both axes from 0 to 1. Then simply use a dimension for the shapes, here I have used the URL.
3. Set up map background images
Go to map > background images. from there add the first image and set the X and Y fields to be 0 to 1. Then if you go to options, you can add a condition to ‘Only show when’. So here I just selected the shapes that corresponded to the images.
4. Insert your new sheet in the tooltips
And you’re done! Don’t know about you but this sets me in the mood for some pizza!