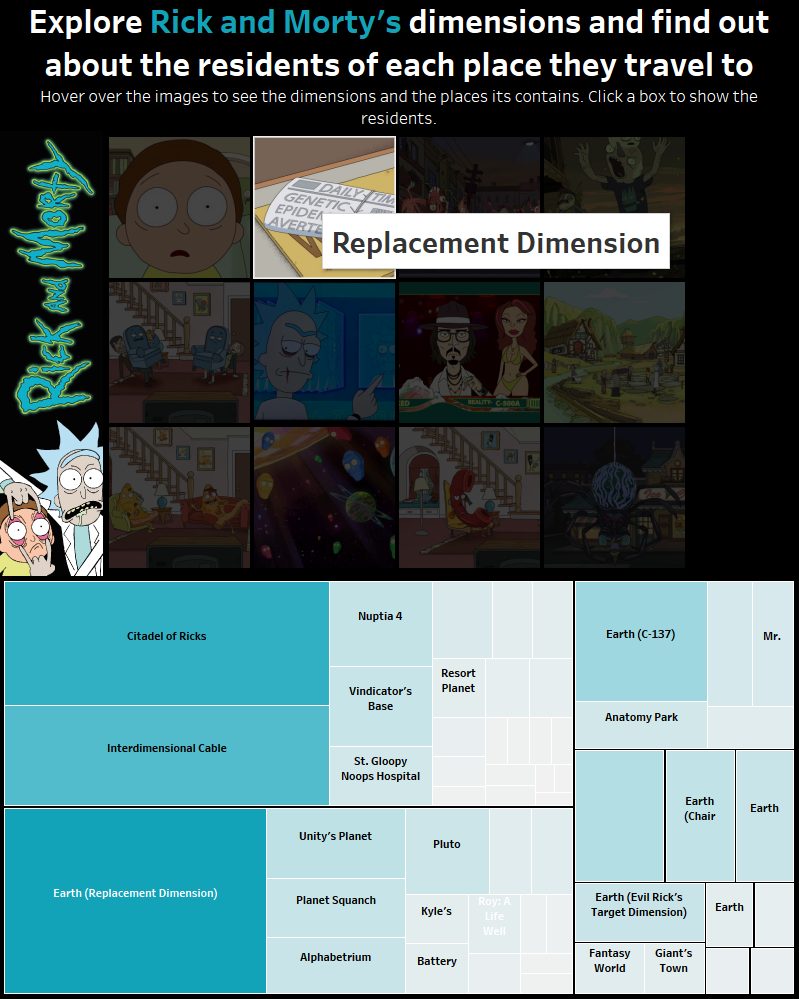
Day 3 is over! This time we were tasked by Andy to download data from Rick and Morty API and build up a viz from there. I had to specifically work with the different locations to be found in the show. It took me a good part of the day working in Alteryx to get the data nice and ready. I wanted to map out the universe and reveal where each character lived.
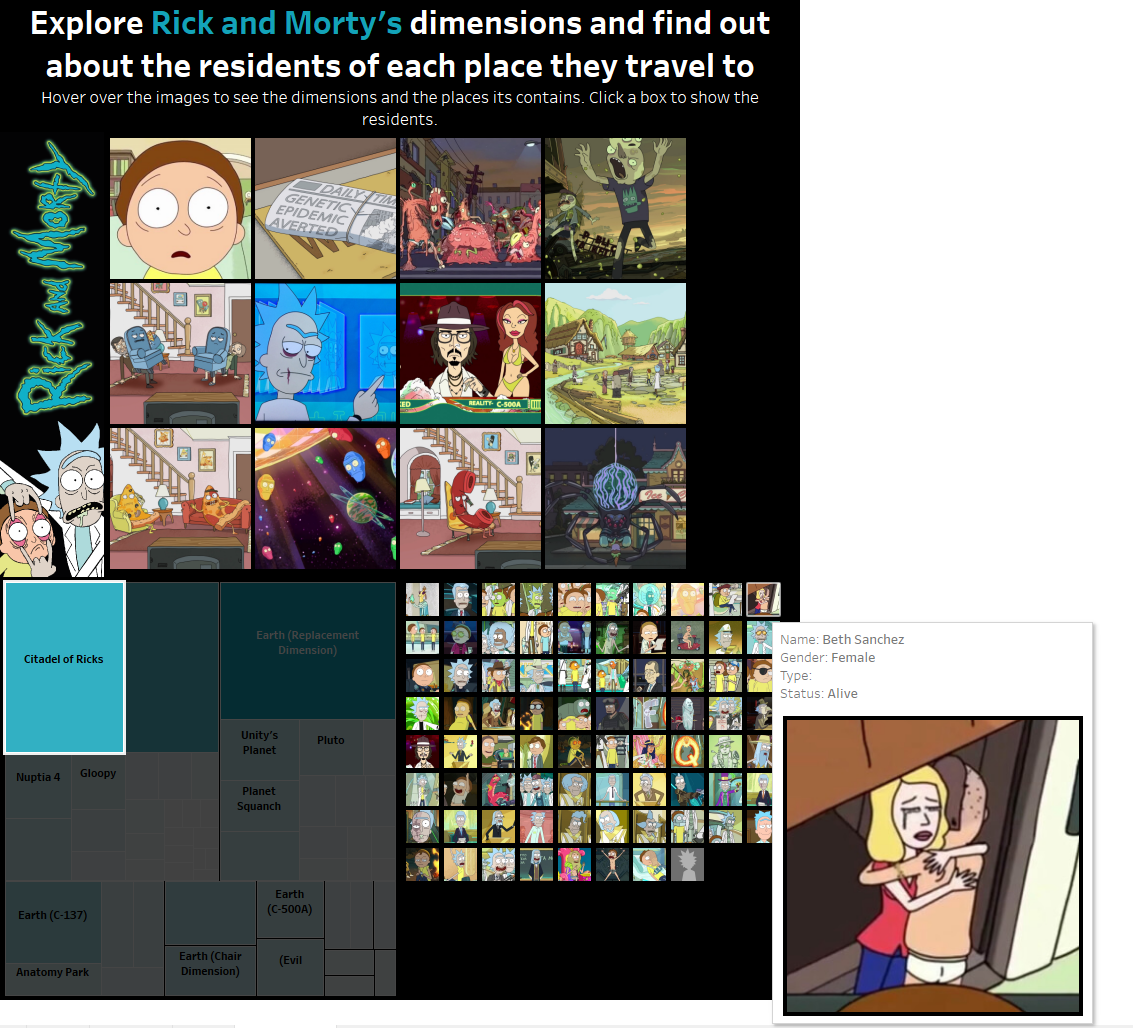
Initially, I had in mind a workout wednesday prepared by Emma Whyte, which gave a way to drill down in a tree map, from the state level to the city level. I wanted to have the ability to drill drown from the different dimensions the two characters explore to all the places they contain and their residents. Although instead of working with a treemap I thought of using images (displayed though shapes instead) to build something more visual.
I yet haven’t figured out a way to do it so I decided in the end to go for dashboard actions to achieve a similar outcome and respect the dashboard week schedule. I will get back to it later to improve it..!
Have a look at it and let me know if you have any feedback or know a way to achieve my original plan!