At the end of last week DSX was tasked with remaking one of the vizzes that were submitted in application to the Data School. Off the top of my head, everyone chose their first viz as the latter one was always the better. Oh, and there was one catch, we needed to use Alteryx to include a new dataset into our original data.
My first application viz was a story (error #1) made of four graphs (error #2) and it looked like this:
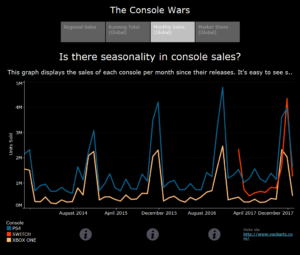
It concerned the regional sales and market trends of the three major home consoles, the Sony PlayStation4, Microsoft’s Xbox One, and the Nintendo Switch.
Not my finest work but it has some solid “technical elements” that make me not incredibly ashamed of it, just mildly so. Doing Andy and Eva’s Makeover Mondays has given me an irrational fear of putting too much into a viz – the thought of including all four graphs and then some inclusion of an extra dataset put me into a cold sweat.
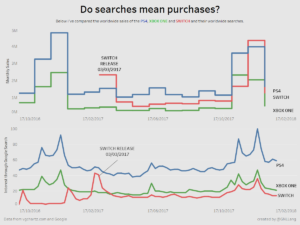
So, I needed to pick the one graph and then come up with a dataset to give a new angle or clarity. Ravi Mistry (@Scribblr_42) came to the rescue and mentioned Google trends as a great source of fit-all data – so I grabbed the data for compared search trends of the PS4, Xbox One and Switch (which I wanted to pair with the sales by month data to see if searches meant purchases). Right, now to run it through Alteryx and then whack it on Tableau and on to a simple dashboard. Alas if only it was so simple. All my data-processing issues came down to a single problem-child column – the date.
Learning from a lot of failure
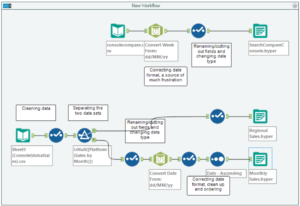
My first Alteryx workflow was made quite easily, the google data was already very usable but the data I tore from my old viz had two data sources rammed together (in unholy union) that needed a bit of work. Alteryx workflow finished, I join them up and DISASTER. So, the obvious join columns are console and date – correct. A simple column for column join? Lord no. You see the google data is set at the start of the week and my original data uses the first of every month – when you join it via an inner join you get only the rows where the start of a week fell on a Monday.
Luckily Carl (@datajedininja) was on hand to assist (read: give me the answer) and tell me the error of my ways. I needed a date trunc function on both sides that would allow the dates to join in a more flexible way – effectively joining them by the month/year of the date rather than the full day/month/year. Job done, went home, thought I’d get the data on tableau so I could focus on the dashboard alone in the morning.
The fool I was. Tableau was having none of it. I spent a few hours staring at the mess on my screen and I asked my colleagues for advice on Convo, who were more than happy to help. Andy told me to go to bed and look at it in the morning. Long story short, Tableau was refusing to take in any date that wasn’t in the month of January, why? Because of the Americans. Let me explain – all of my data before alteryx was in a British (also used in the rest of the civilised world) date format (dd/mm/yyyy) – went through Alteryx – then into tableau (also using the correct date formatting). Where’s the problem? It’s with the Americans in the middle who for SOME REASON force their date format on the rest of us. Alteryx had defined my date column as (mm/dd/yyyy) without asking so I had to go back and add a DateTime tool to correct the date format.
The final product
Right now, finally on to the dashboard, which is good as the deadline of 1pm Friday was a few hours away. I wanted very little on my dashboard, solid colour scheme where the data is the focus. It’s not perfect and honestly, it’s missing… something. But at least it’s not busy. If you could give me any feedback in the comments, even if it’s just a little thing that you think could be improved.