


In this post I’ll show you a quick labelling method using the Rank table calculation, along with how to correctly configure the calc. I will use the sample superstore and to begin with would like to label the top three weeks in 2019 by sum(Sales) for each Region.
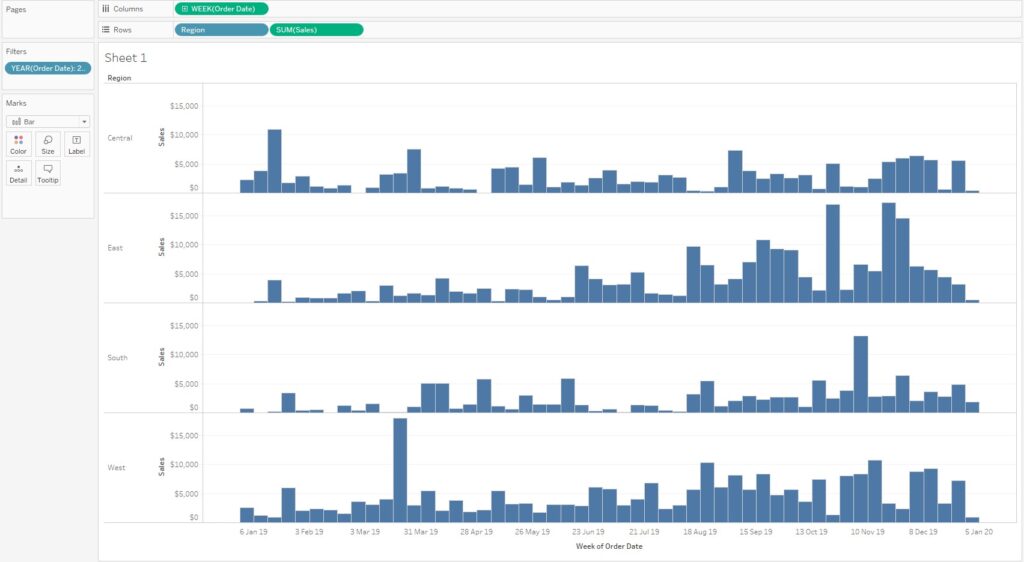
- R-click and drag Order Date on to columns and select continuous week.
- Drag Sales on to rows – make sure it’s sum(Sales) – and change chart type to bar.
- Drag Region on to rows .
- Drag order date on to filter and filter to a single year, I chose 2019.
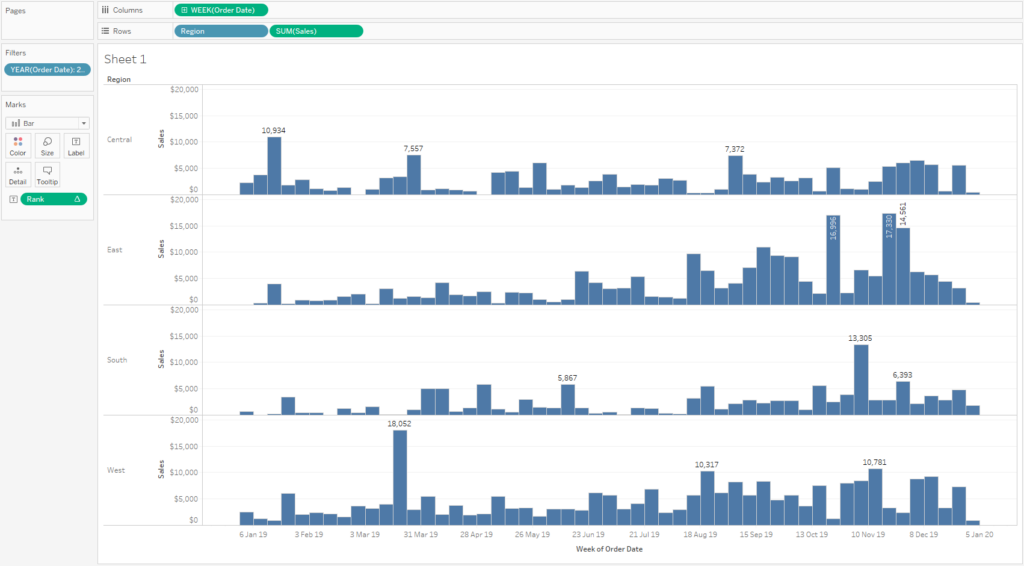
Create a calculated field called Rank. This should contain the following calculation:
if RANK(SUM([Sales])) < 4 then SUM([Sales]) END
Drag the Rank calculation on to the Label shelf and the weeks with the top three sales per region should automatically be labelled. This function uses the rank table calculation to rank weeks by sum of sales in ascending order (i.e. starting from 1). Since we included a cutoff of <4, the calculation only returns ranks 1 to 3, hence only these weeks are labelled.
In order to display the top 4 weeks for example, we could simply change the rank cutoff to 5.
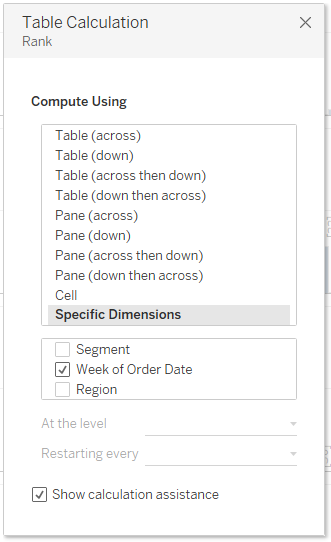
By default Tableau has set the rank calculation to compute using table across, but we should take care to configure it correctly to suit our needs.
Let’s say for example that we now want to see the weeks with the top 3 sales by Region and Segment. Dragging segment on to columns splits the view accordingly but only shows the top 3 weeks across all segments.
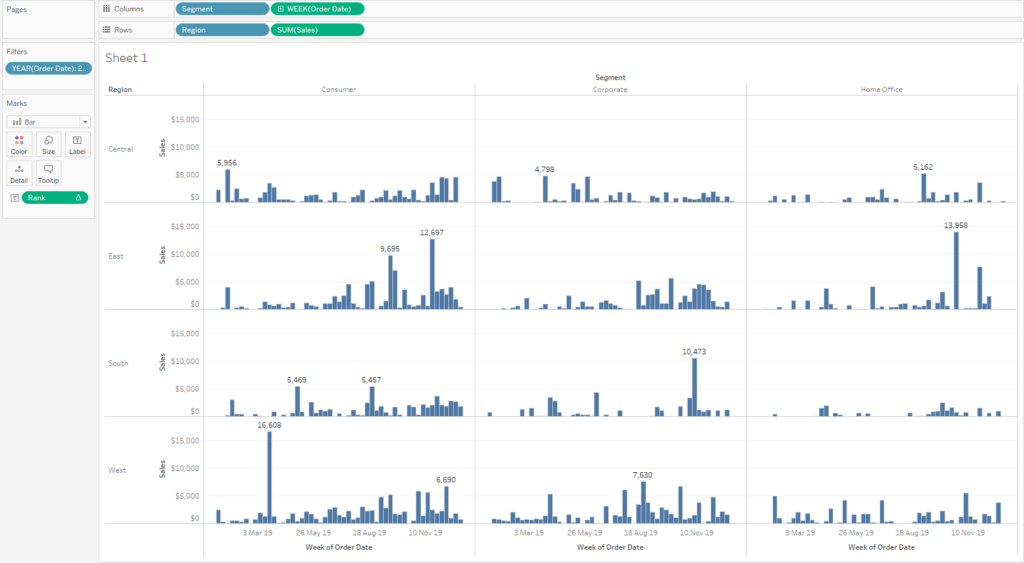
To see the top 3 weeks for each region AND segment we have to right click the Rank table calculation and choose compute using specific dimensions. Initially both Segment and Week of Order Date are checked. We want to un-check Segment, and leave Week of Order Date checked.
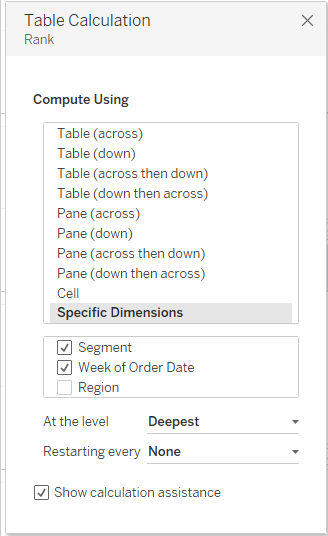
Now our view displays as we would like it. This configuration can be read as ‘for each region and segment, rank the sum(Sales) by Week of Order Date.’ It is good practice to always ‘lock in’ a table calculation as soon as you create it using specific dimensions.
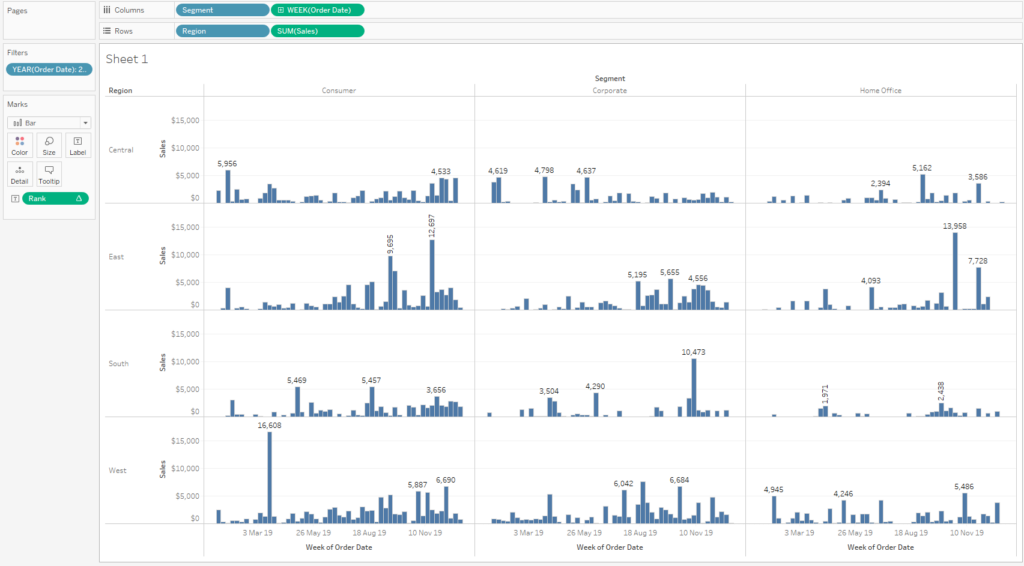
(Note that there appears to be only to labels in some panes, this is because the label marks are overlapping).
For more information on table calc specific dimensions check out these data school blogs: