Understanding the logic behind Table Calculations in Tableau can be tricky at first. Hopefully by reading this blog post you will understand them a little better.
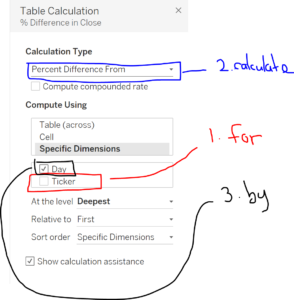
Firstly, lets have a look at the Table Calculation configuration window below:
As you can see, it can be quite overwhelming, so for this we are only going to focus on the areas highlighted in the picture.
In blue you can see what kind of calculation you are computing with. In this case it is the Percent Difference From.
In red and black you can see the checked boxes within Specific Dimensions within the ‘Compute Using’ area.
So what do each of these mean?
Let’s say I have a year’s worth of stock ticker data, and our mission is to understand the percent change in the daily close prices – and we want to see this for each day in a line graph, for each ticker.
We want our result to be something like this:
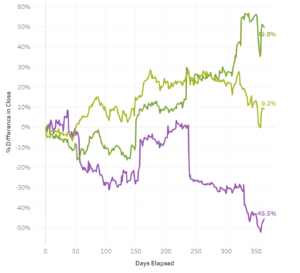
So what we want to understand is; FOR each ticker. We want to CALCULATE the % difference of Close Price BY each day
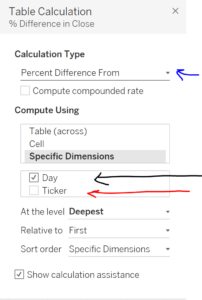
Within the window the unticked box is your FOR, calculation type is your CALCULATE and the ticked box is what you are calculating BY.
To visualise this in the window, see below: