I’m about a month into my Data School training now, and the thing I’ve found most frustrating about Tableau so far is doing calculated fields.
Simple ones are fine, because I can think through the logic. For example, take this dataset where I’m looking at the different items confiscated by the TSA in airports across America. Every line of the dataset represents every item confiscated, with information about what it was, where it was, when it was, etc. So, if I want to know how many items were confiscated, I could store COUNT(item) as a calculated field, like this:

This would update to whatever conditions I dragged onto the view. Number of items per airport? Sure thing, just drag airport onto the view, and the calculated field now counts the number of items at each airport.
I can also do a level of detail calculation to work out how many item confiscated there were per airport and control for how many passengers passed through that airport (this was labelled “enplanements” in the data source. “Enplanements” is not a word). This calculation takes the number of items at each airport and divides it by the number of passengers to give the average number of items confiscated per person in that airport.

I then used this average per airport to work out how many items of each type were confiscated per person in airports in Democrat and Republican states respectively.
The problem is that at no point during this process am I quite sure if the numbers that Tableau is spitting out are actually the right numbers. I spent a fair amount of time playing around with the calculation, and got different figures depending on what I did… and so I ended up double checking the calculations in Alteryx all the time anyway.
What I love about Alteryx is being able to run the workflow and, crucially, being able to see the numbers at every step of the calculation. Tableau feels a bit “black box”-y, where I’ve got my input at the start, my graph at the end, and a calculation which might or might not be correct. In Alteryx, I can step it through and check it makes sense.
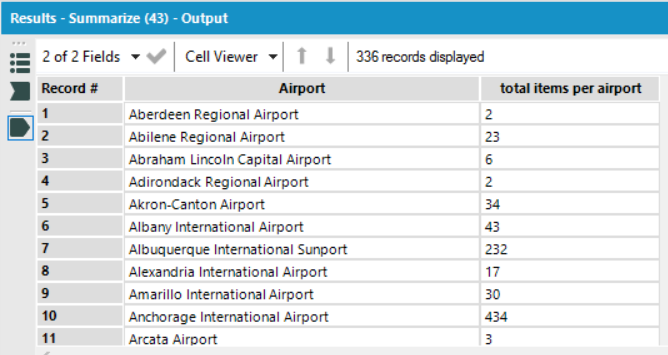
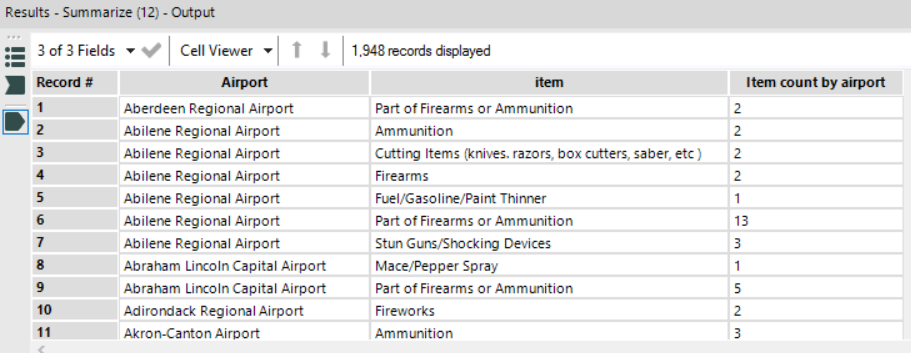
I did this by dropping a Summarize tool in the workflow, grouping by airport, and counting the items to give me the number of things confiscated at each airport. I did the same again, but grouping by airport and item and then counting the items to give me the number of each type of thing confiscated at each airport.


I then dropped two Formula tools into the workflow; one to divide the total items at each airport by the total passengers at each airport (= number of things confiscated per passenger at that airport), the other to divide the number of each type of item at each airport by the total passengers at each airport (= number of each type of thing confiscated per passenger at that airport).


By adjusting my filters in Tableau and checking that the numbers matched up, I was able to check that I’d actually done the calculated field properly (which, for a long time, I hadn’t).
So, here were two ways of calculating the same thing, one in Tableau, one in Alteryx. I found the Alteryx way far, far more reliable, because I could see each level of the calculation, which allowed me to be confident that my data was right. For small to medium datasets, I will probably just do it all in Alteryx and store the calculated fields as extra columns in my output. This may be more of a problem with big datasets, as the Alteryx output data will take up more and more memory… but in this case, with 22,000 rows, the difference between output file size with an extra couple of columns was a matter of kilobytes. That trade off is worth it to me.
