


Today’s blog is on “how to be successful in the Data School”. I’m not sure I’m the one to be the judge of that – you’d have to ask Andy whether or not I’ve been successful – but one thing I keep coming back to and fixating on is basic numeracy and checking your figures.
The magic of Tableau means that most of the calculations in vizzes are done for you automatically. This is great, because it makes things easy. But it’s also terrible, because it becomes far too easy to rely on Tableau’s answer without double-checking the numbers.
One example of where I noticed this was in Makeover Monday week 49 with the global flow of people data. The dataset had a line per origin country and destination country, and then aggregated regional values, like so:
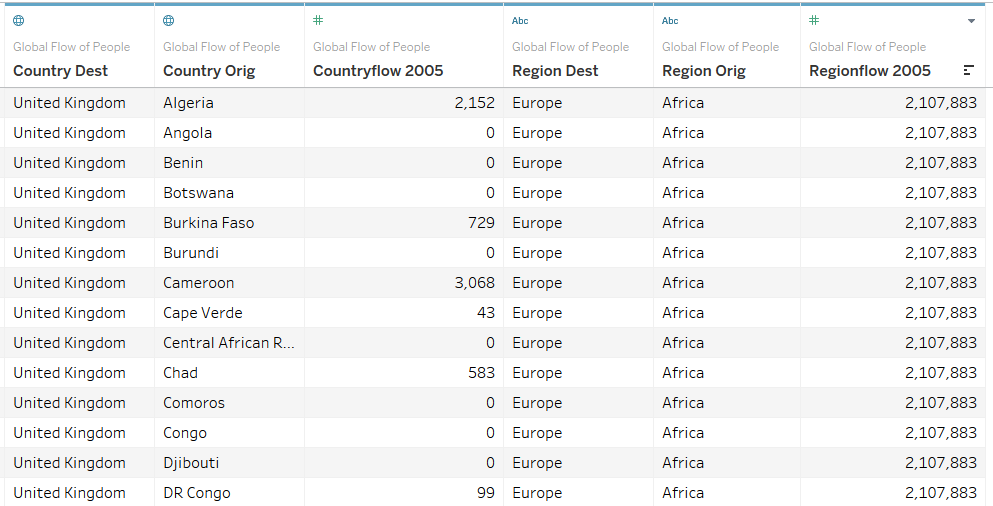
This meant that the figure of two million or so for Europe in 2005 was already the sum of people moving from Africa into Europe; that’s the 2152 people moving from Algeria to the UK, the 583 people moving from Chad to the UK, the however many people moving from Namibia to Germany, all added together. But, Tableau’s default setting is to sum up numbers in columns, and will happily do that for all numbers in columns unless you tell it not to:
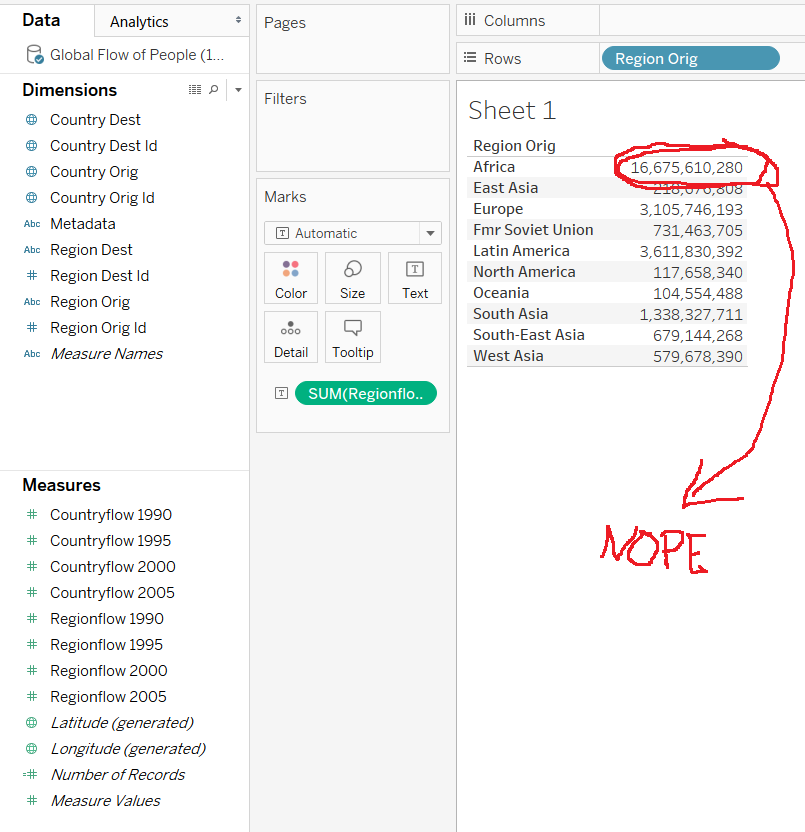
…which means that Tableau thinks over sixteen billion people migrated out of Africa in 2005, despite that number being more than double the entire global population. In the case of migration from Africa to Europe, it comes up with three billion instead of two million. That’s a pretty big disparity. I saw quite a lot of vizzes that week with incorrect figures like this, because it’s too easy to rely on Tableau to do the right thing without working through the numbers yourself.
This example is easy to catch, at least. But what if you’re working on a client project, and you accidentally sum up a column that’s already an aggregate value? Or you create an average by including zero values where zero values shouldn’t be included? Or you assume that the dataset is ordered chronologically when it’s ordered alphabetically, or not ordered at all? If you’re not careful, you will misrepresent the underlying data and create fake statistics.
This matters. You are being paid to do this because the client organisation doesn’t have the expertise to do it, so they’re going to trust your work and your insight. Your mistakes have real life consequences. A fake statistic which shows that a branch of a shop is unprofitable could result in closure and redundancies. That’s a dozen people laid off, even though it was you who didn’t do your job properly rather than them. A fake statistic which shows that a product is safe to use could result in a dangerous product being released on the market. That’s injuries or deaths caused by your carelessness.
This sounds a bit doom and gloom, but it’s critically important. With great data comes great responsibility. Don’t assume that you’re right just because Tableau doesn’t throw up an error. Check your figures.