It’s the third day of our Dashboard Week and we were tasked with visualising consumer complaints in America. The data was already prepared by Coach Andy and to make things more interesting, the 14th cohort was tasked with the same thing. Not sure it is actually part of our Dashboard Week since there was no blog post with the task and we weren’t asked to write a blog post but I thought I’d do it anyway.
Data
We’ve got a single file that’s massive 695 MB of a CSV file with over 1.2M records. The data is from the Consumer Complaint Database and I was very happy to see that they have Data Dictionary!
The data doesn’t seem that exciting though. Especially when you compare it with our Avengers data from yesterday… But I guess we can’t expect to deal with superheroes data every day. Sadly.
Plan
I thought after a look at the data (which took me quite a while since the data has 20 fields or so), I’ll plan out my dashboard. But the inspiration eluded me. Not a great start.
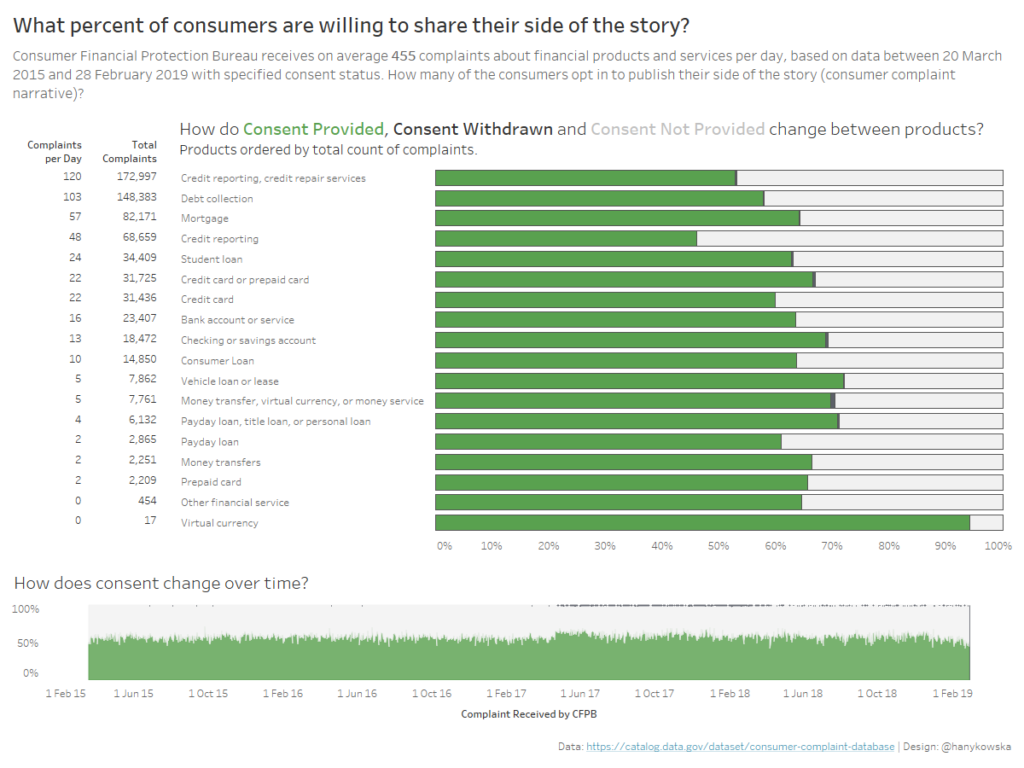
Looking at the data, I was trying to think of something that others will be unlikely to do. And so I stumbled across consent and thought to create something from consent perspective. It’s not very exciting since the consent is only about publishing the consumers’ side of the story. I still thought it might be an interesting view.
The plan wasn’t there for me today. I usually try to draw things out, but today was not the day for it. I had a vague idea of what I maybe wanted to do…
Tableau
I decided to have a play with the data in Tableau. Maybe not the best practice but it worked for me. I started with a simple bar chart that turned into a stacked bar chart. Then I thought about consent over time and so I ended up with a ‘grass’ chart (stacked area chart). You can see my final dashboard below: