Following up on Jon’s post on copying and pasting data directly into Tableau, I just wanted to add, that you can do that with the data you already have in Tableau. Wait a minute, but why would I paste the data I already have in Tableau? In some cases, which I’ll discuss, it may save you some time. Perhaps it’s not the best approach but if it’s a one-off and you don’t want to faff around with data, it may be useful.
Use case
Let’s have a look at a situation, this could be (and actually was) applied to.
For my application viz, I used data from Kaggle Survey. It meant that I had to deal with survey data, which I’d never done before. Probably not the best decision but it still got me to the interview.
I chose this dataset because I had taken part in that survey so I knew more or less what was in it and I was just curious about the results. There were 50 questions total and some of them had multiple parts, number of which easily reached double figures. As some of the questions were multiple choice, all of the parts of a question were saved as separate fields. In the end there were over 400 fields (columns) and many were referring to the same questions.
This wasn’t that much of a problem in simple questions, but I wanted to show the popularity of specific media platform with highlighting of top 5 positions. It turned out I didn’t quite know how to build a calculation that would deal with 20 or so fields. Or maybe I was just lazy. Either way, I decided I needed to do something about it.
I think I might have researched the problem and I’m very sorry but I simply don’t remember how I got across the concept of copying part of your own dataset to solve it. Thus, I can’t give appropriate acknowledgement to the author of the idea.
How to
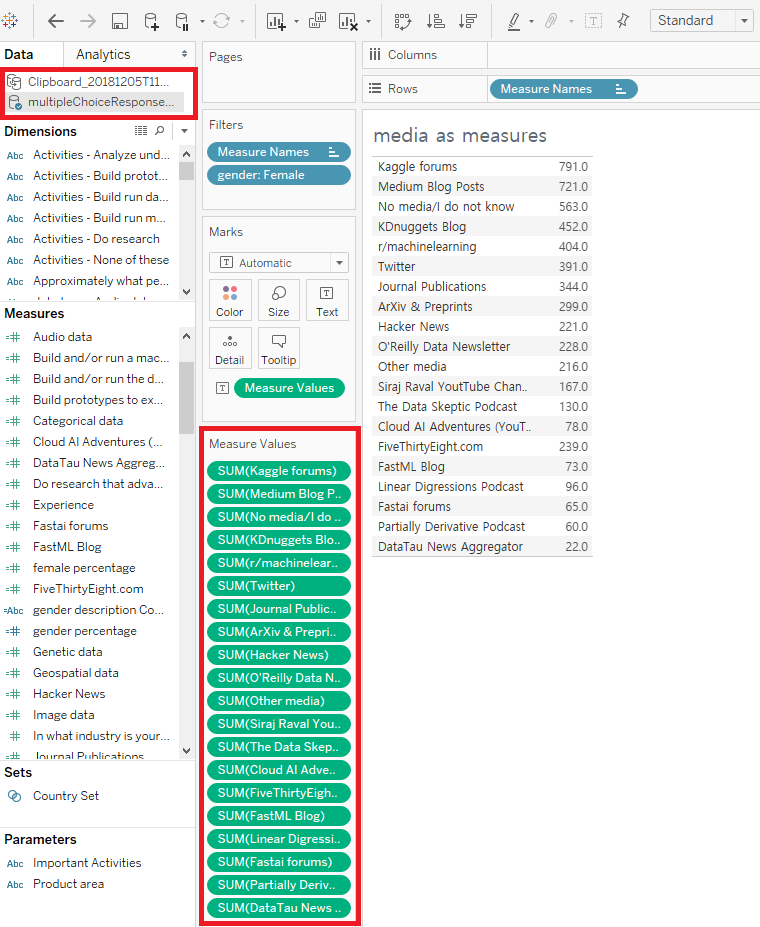
To understand the situation, here’s what my view looked like originally:

You can see at the top that I already have two datasets, one of which is from a clipboard. This is because I used that trick already to get the visualisation I wanted. Notice how many measures are there on the measures shelf. TWENTY. Who wants to take care of that many measures when they all relate to the same question?
Here’s what you want to do.
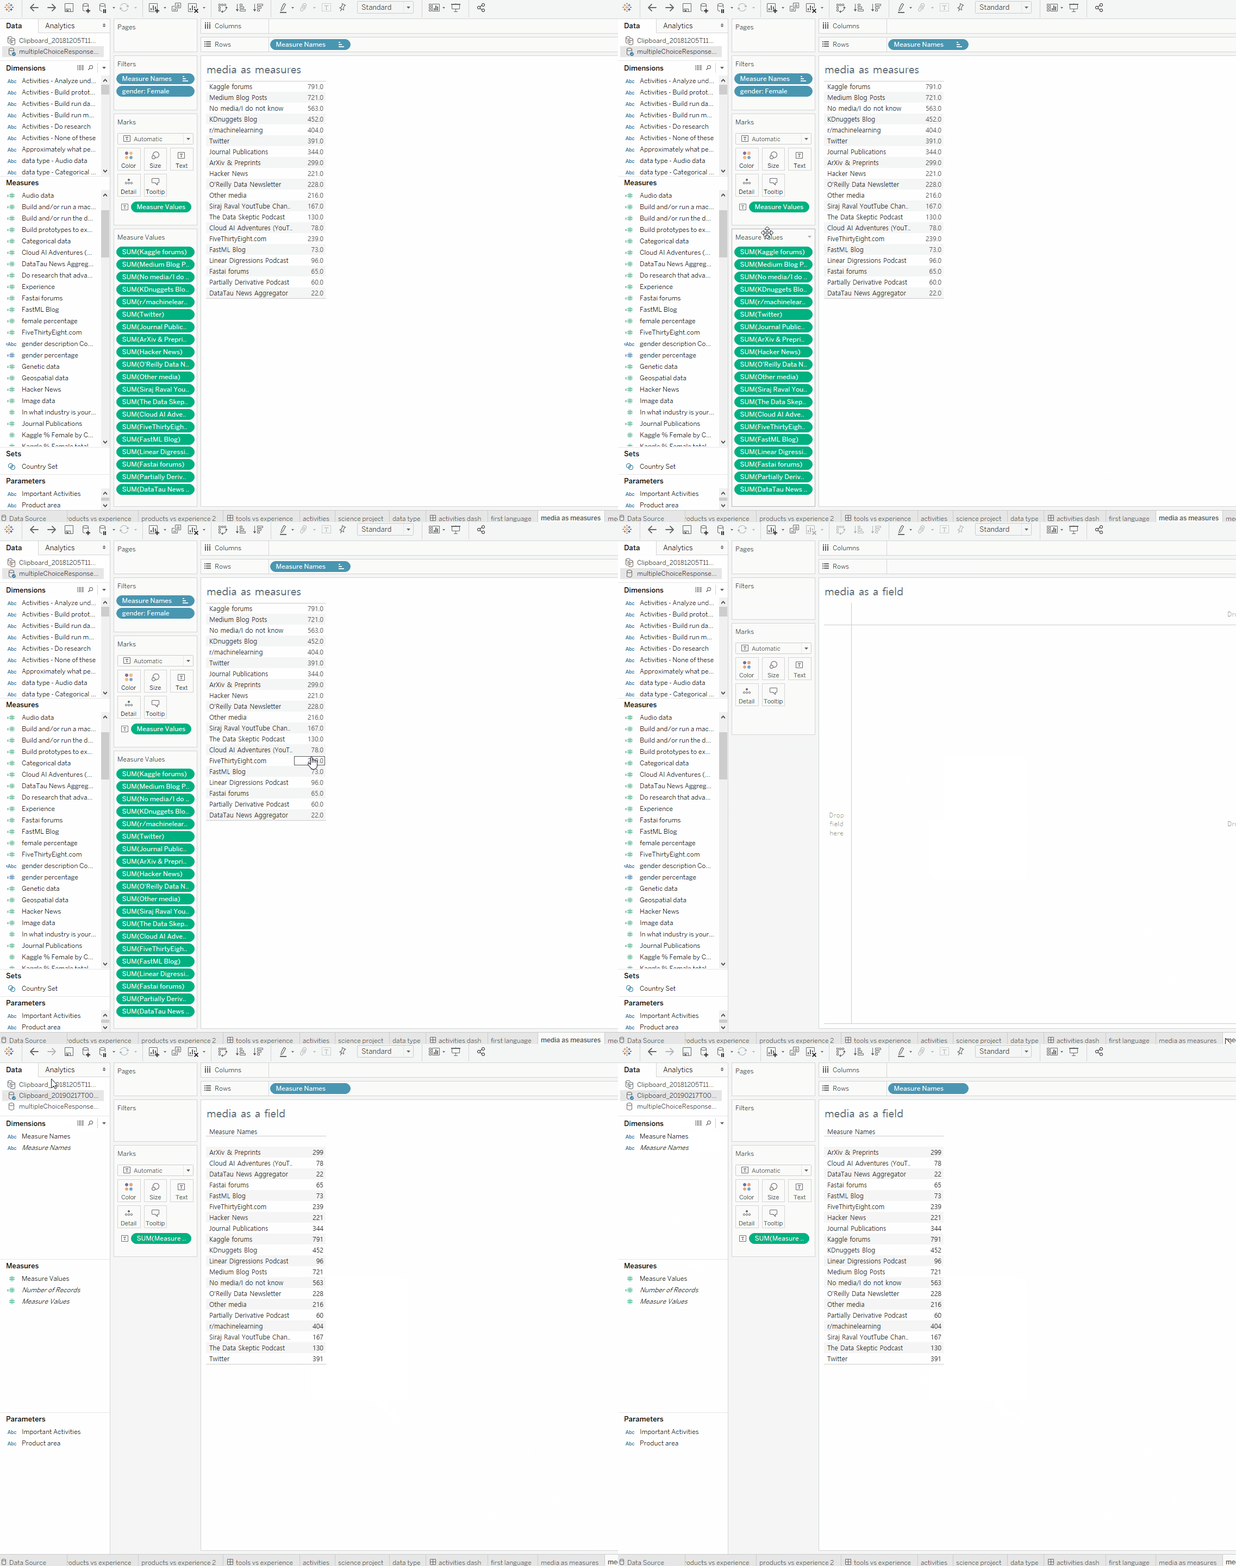
- Right-click on on any value in the view and hit ‘Select All’.
- ctrl+c (or mac equivalent) to copy.
- Go to a new sheet and ctrl+p to paste your data.

Simple, isn’t it?

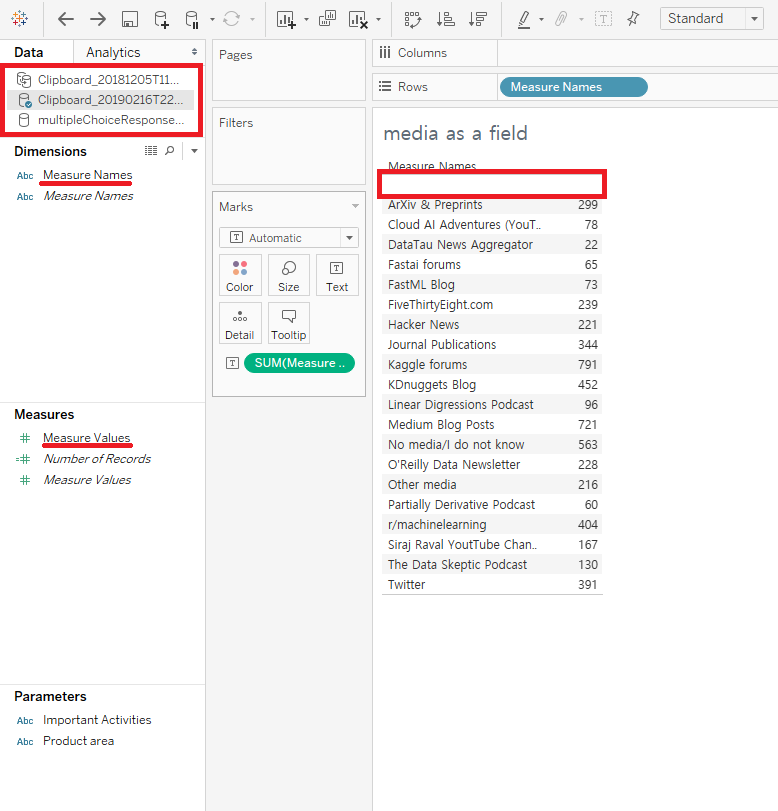
View after pasting the data. Notice extra Clipboard position and no measures on the measures shelf.
The measures shelf disappears. A new data source is showing up that seems to be named as ‘Clipboard_yyyymmdd_T_hhmmss’. The names of the fields are also automatically saved as ‘Measure Names’ and ‘Measure Values’. Not ideal, could make things a bit confusing. And there’s also this blank space.
To deal with these, you can also continue with the following steps:
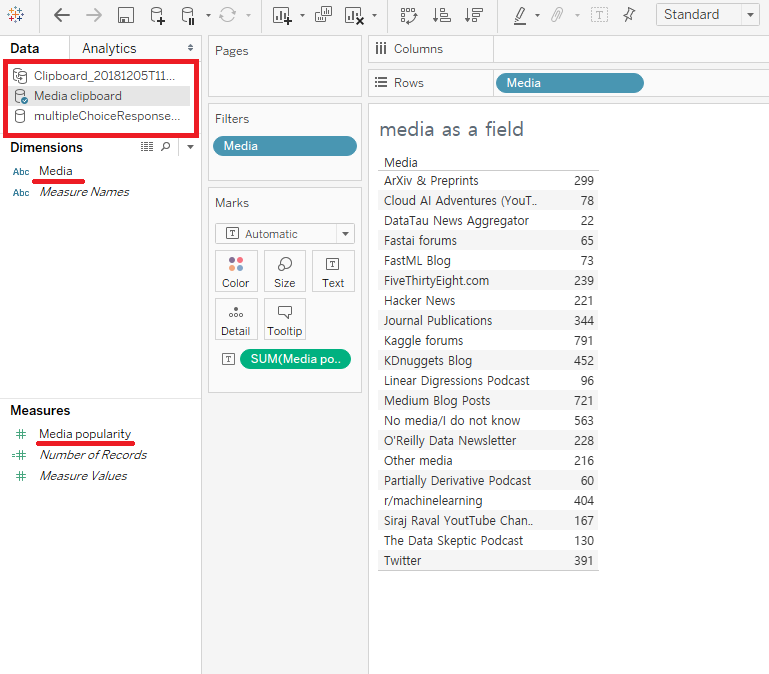
4. Change the name of the data source (right-click on its name and hit ‘Rename’). Use something informative so that later you know what that is.
5. Rename the fields to make sense (right-click on its name and hit ‘Rename’ or select the field and hit F2 on Windows). I used ‘Media’ instead of ‘Measure Names’ and ‘Media popularity’ instead of ‘Measure Values’.
6. Exclude the empty value. (right-click on the empty row and hit ‘Exclude’. I’m not sure why does it come up, but I assume it has something to do with selection and whitespace characters. Anyway, it doesn’t really bother me that much.)
There you go! You have a simplified version of your data that you can play with further:

The Dangers
There are a few problems with this approach. Firstly, I highly doubt it’s the best practice. Second, it doesn’t update, so if you want to use some filters on the data, it won’t work for you. This holds also, if it should update based on new data (Live connection). I assume there are more problems with it, but there are some positives too.
The Benefits
If the viz is a one-off kind of story, than this trick solves your problem in a rather quick way. For a static visualisation and a summary view, it will work.
Having said that, I thought I was creating a one-time viz and then I had to improve it during our first project at DS. I could have expected that, but it slipped my mind. I’m looking forward (kind of) to a session on survey data so that I can learn how to properly deal with the data set that I had. Look out for a blog post, because there will definitely be one.
In summary, this trick may be useful in some situations but it may be the case of dangers outweighing benefits. In other words, do it at your own risk.
