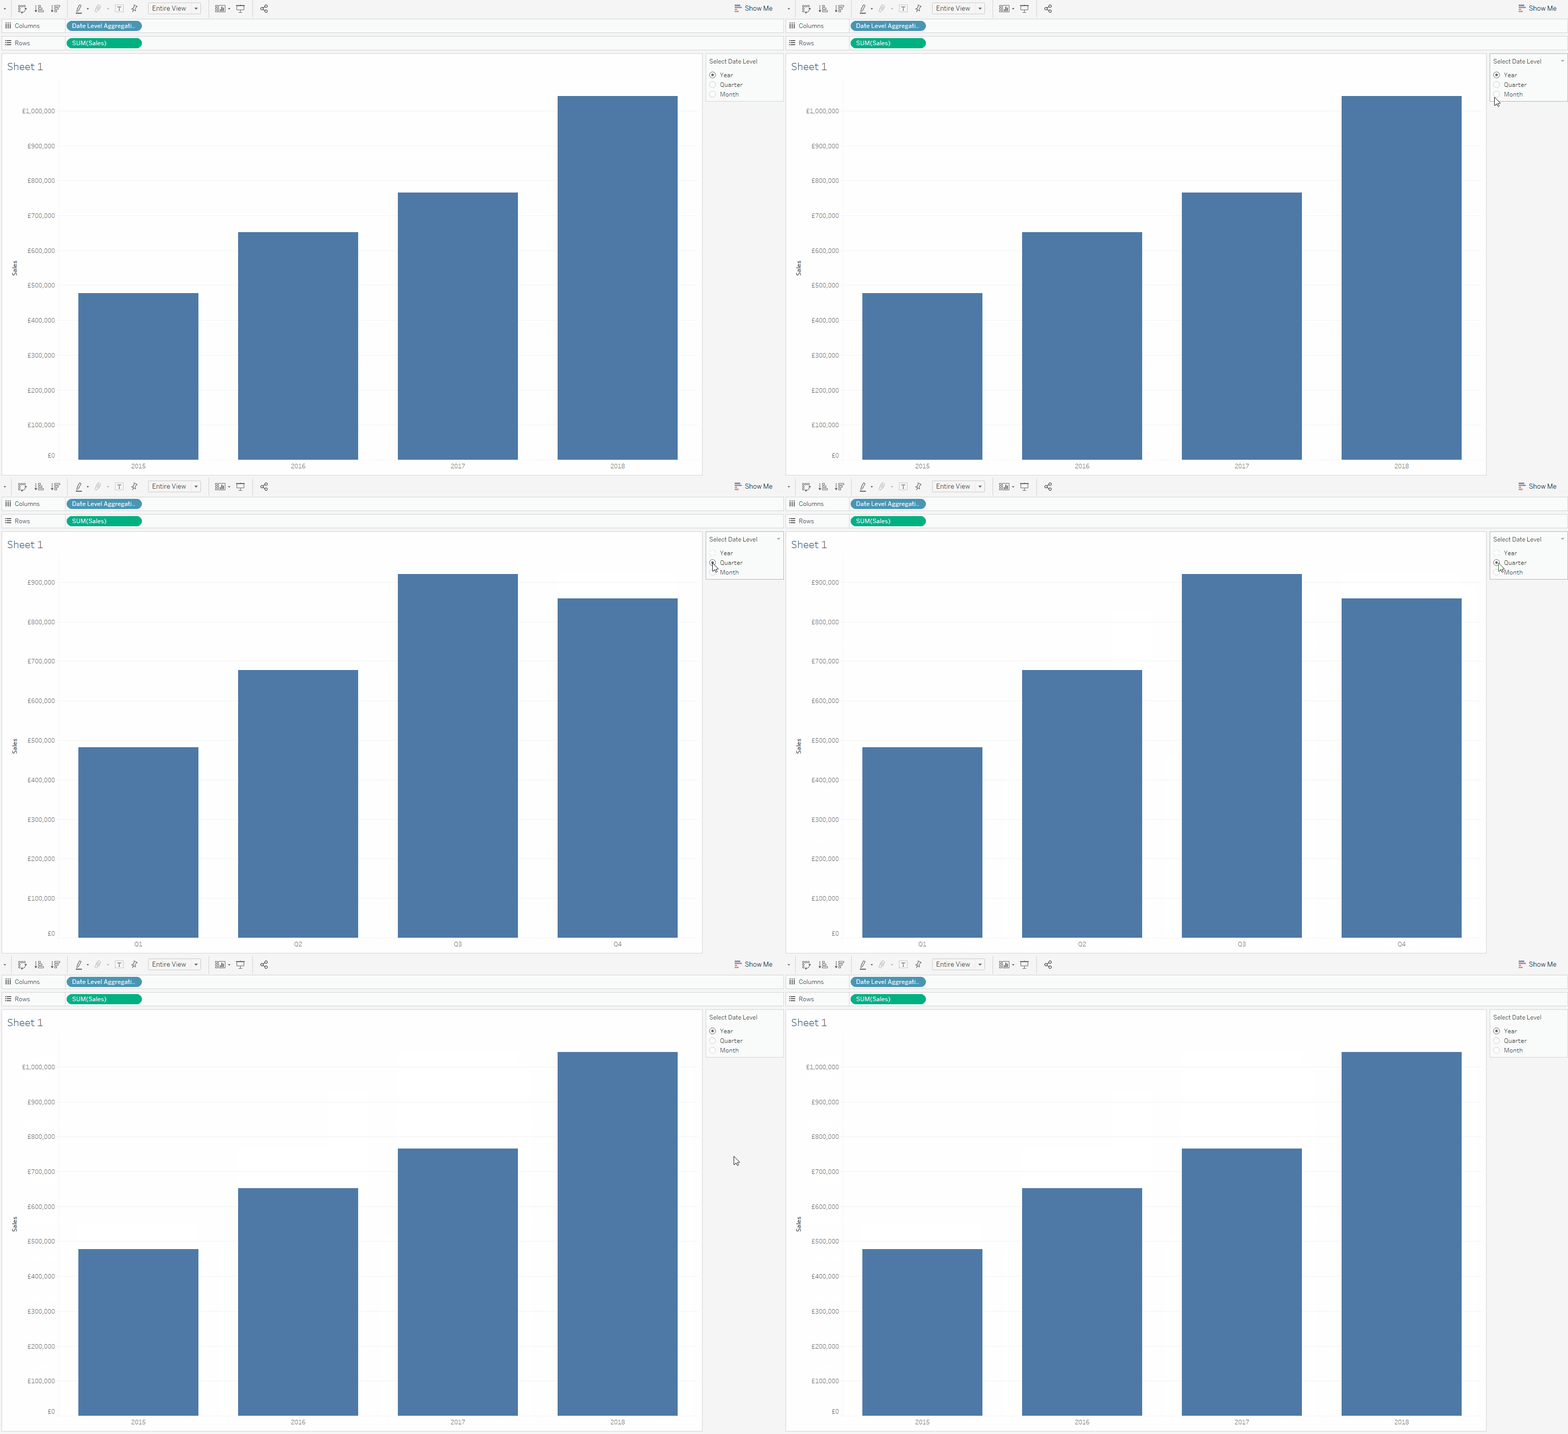
For one of the exercises yesterday, we had to create a view that dynamically changed the date level depending on the user’s choice (year, quarter, month). Today, I’m going to show you how to do it.
Goal

As you can see, depending on the choice in ‘Select Date Level’ section, the view adjusts accordingly and shows the sum(Sales) at the year, quarter or month level of Order Date.
How To
1. Parameter
I’m going to use Sample – EU Superstore data set from Tableau for the purpose of this tutorial. To get the result we want, we need a parameter. This is exactly what the user will change. Let’s create the ‘Select Date Level’ parameter, set the data type to string and allowable values to List. It’s important what we put in the list: start with value field and type in ‘year’, ‘quarter’, ‘month’ all in separate rows, make sure they are all lowercase. Thankfully, we can change what the user sees, let’s change Display As to title case. This is what your settings should look like:

It’s important that you type in lowercase in Value field because anytime you change the Value, Display As will also update. However, if you change Display As, the value stays unchanged.
2. Calculated Field
If you ever worked with parameters, you know you need a calculated field to actually use the parameter functionality. If you’re new to parameters, now you know 😉
Usually, you create a field that checks the value of the parameter and then performs a certain function. Due to characteristics of dates and associated functions we can do it slightly differently, in a shorter way. Let’s create a calculated field called ‘Date Level Aggregation’:
DATENAME([Select Date Level], [Order Date])What’s happening here: I used DateName function because it returns a string for the date part of the given date. For year and quarter, it will return the number as a string, for month, it will return the name of the month (eg. January). [Select Date Level] should be purple on your screen, as it is a parameter; it is also what we use as the date part. Because we’re using the parameter in the function, the values need to be lowercase so that Tableau recognise them as valid arguments.
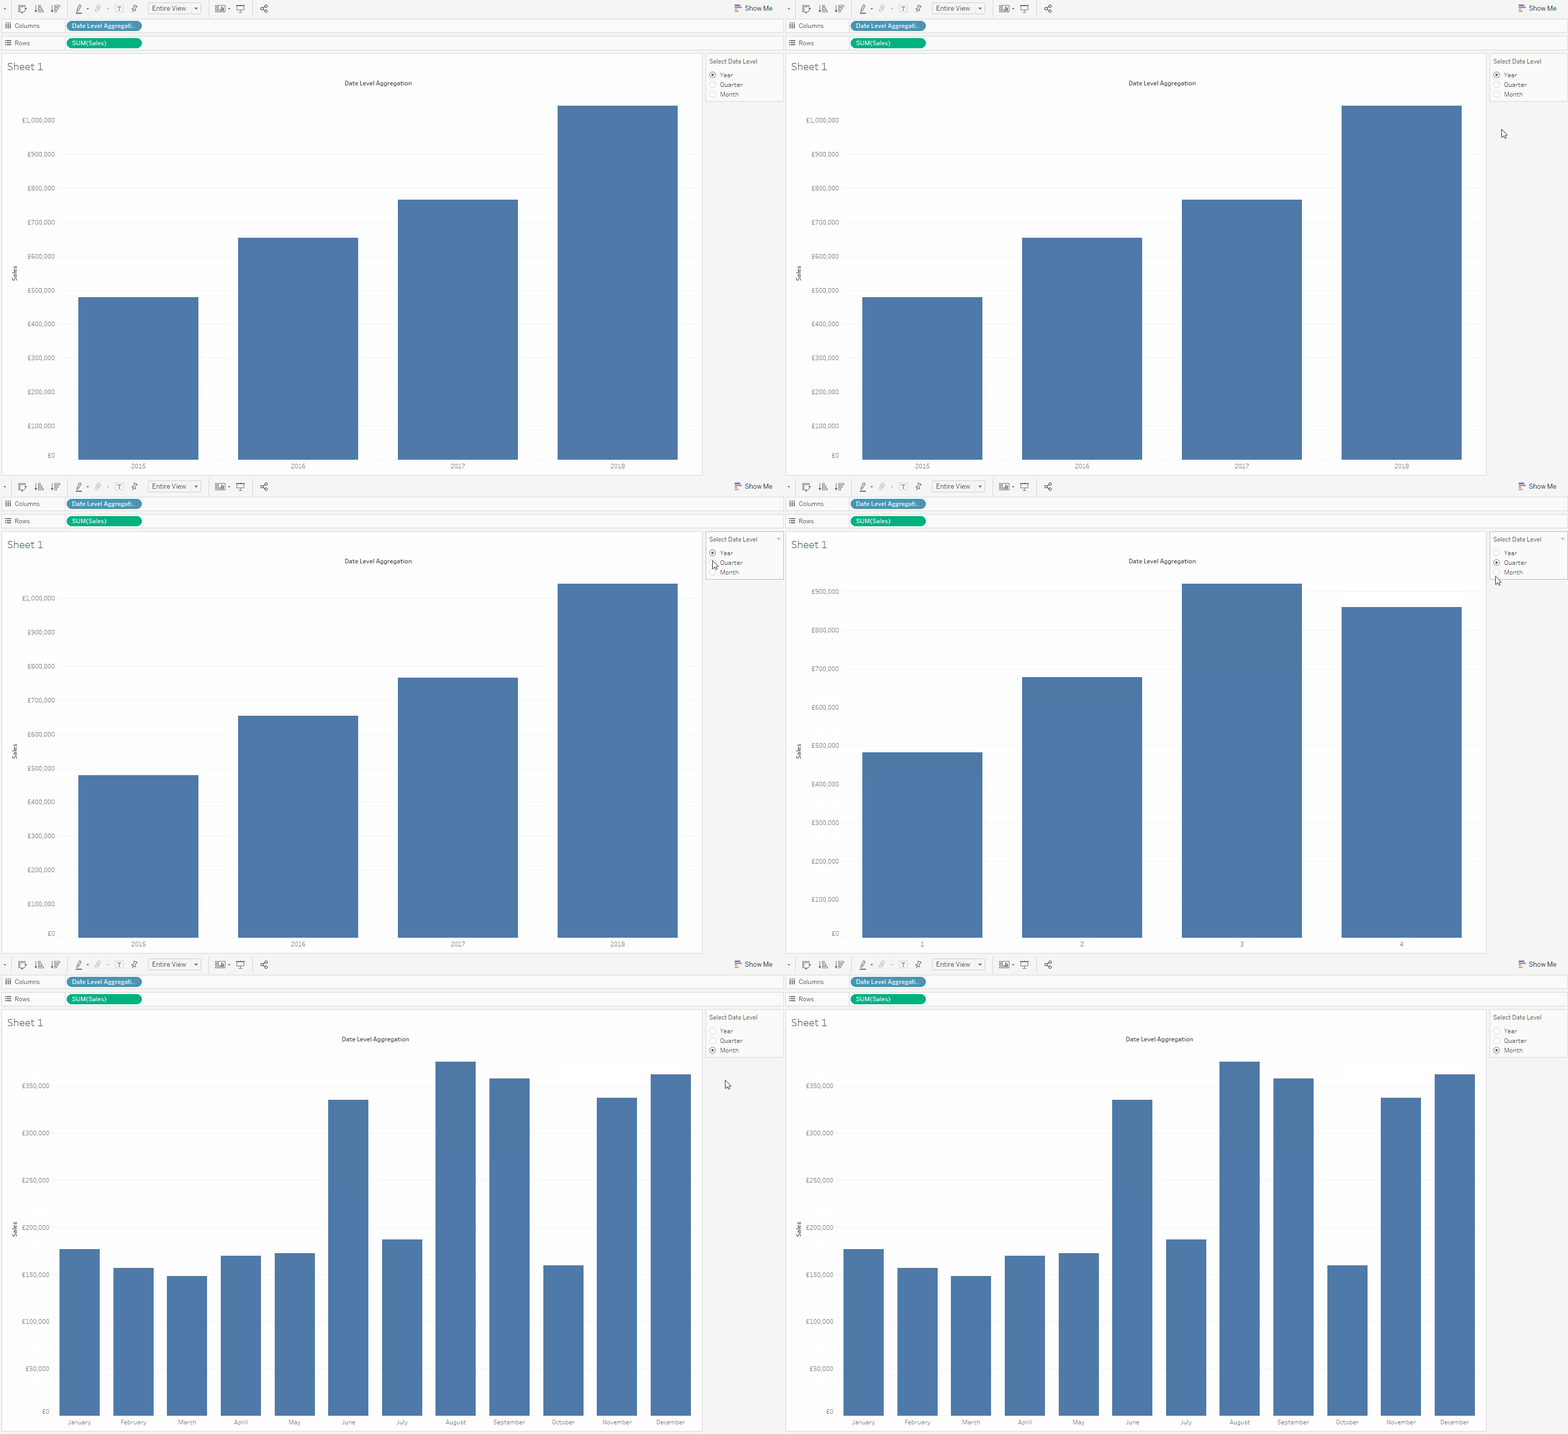
Let’s create the view. Drag Date Level Aggregation on Columns shelf and Sales on Rows shelf. Right-click on the Select Date Level parameter and check ‘Show Parameter Control’. We want to allow only one option to choose. To get that, click on the caret in the parameter control (should be on your right-hand side) and select ‘Single Value List’. I also change the fit to Entire View. This is what your view should look like:

Hold on, we want the quarters to show up as ‘Q1’ not just ‘1’. Alright, calm down, we’ll fix it. Originally, I created the following If-Statement:
IF [Select Date Level] = 'quarter'
THEN 'Q' + DATENAME([Select Date Level], [Order Date])
ELSE DATENAME([Select Date Level], [Order Date])
END
But with Jon‘s help we managed to make it even neater:
IF [Select Date Level] = 'quarter'
THEN 'Q'
ELSE ''
END
+
DATENAME([Select Date Level], [Order Date])
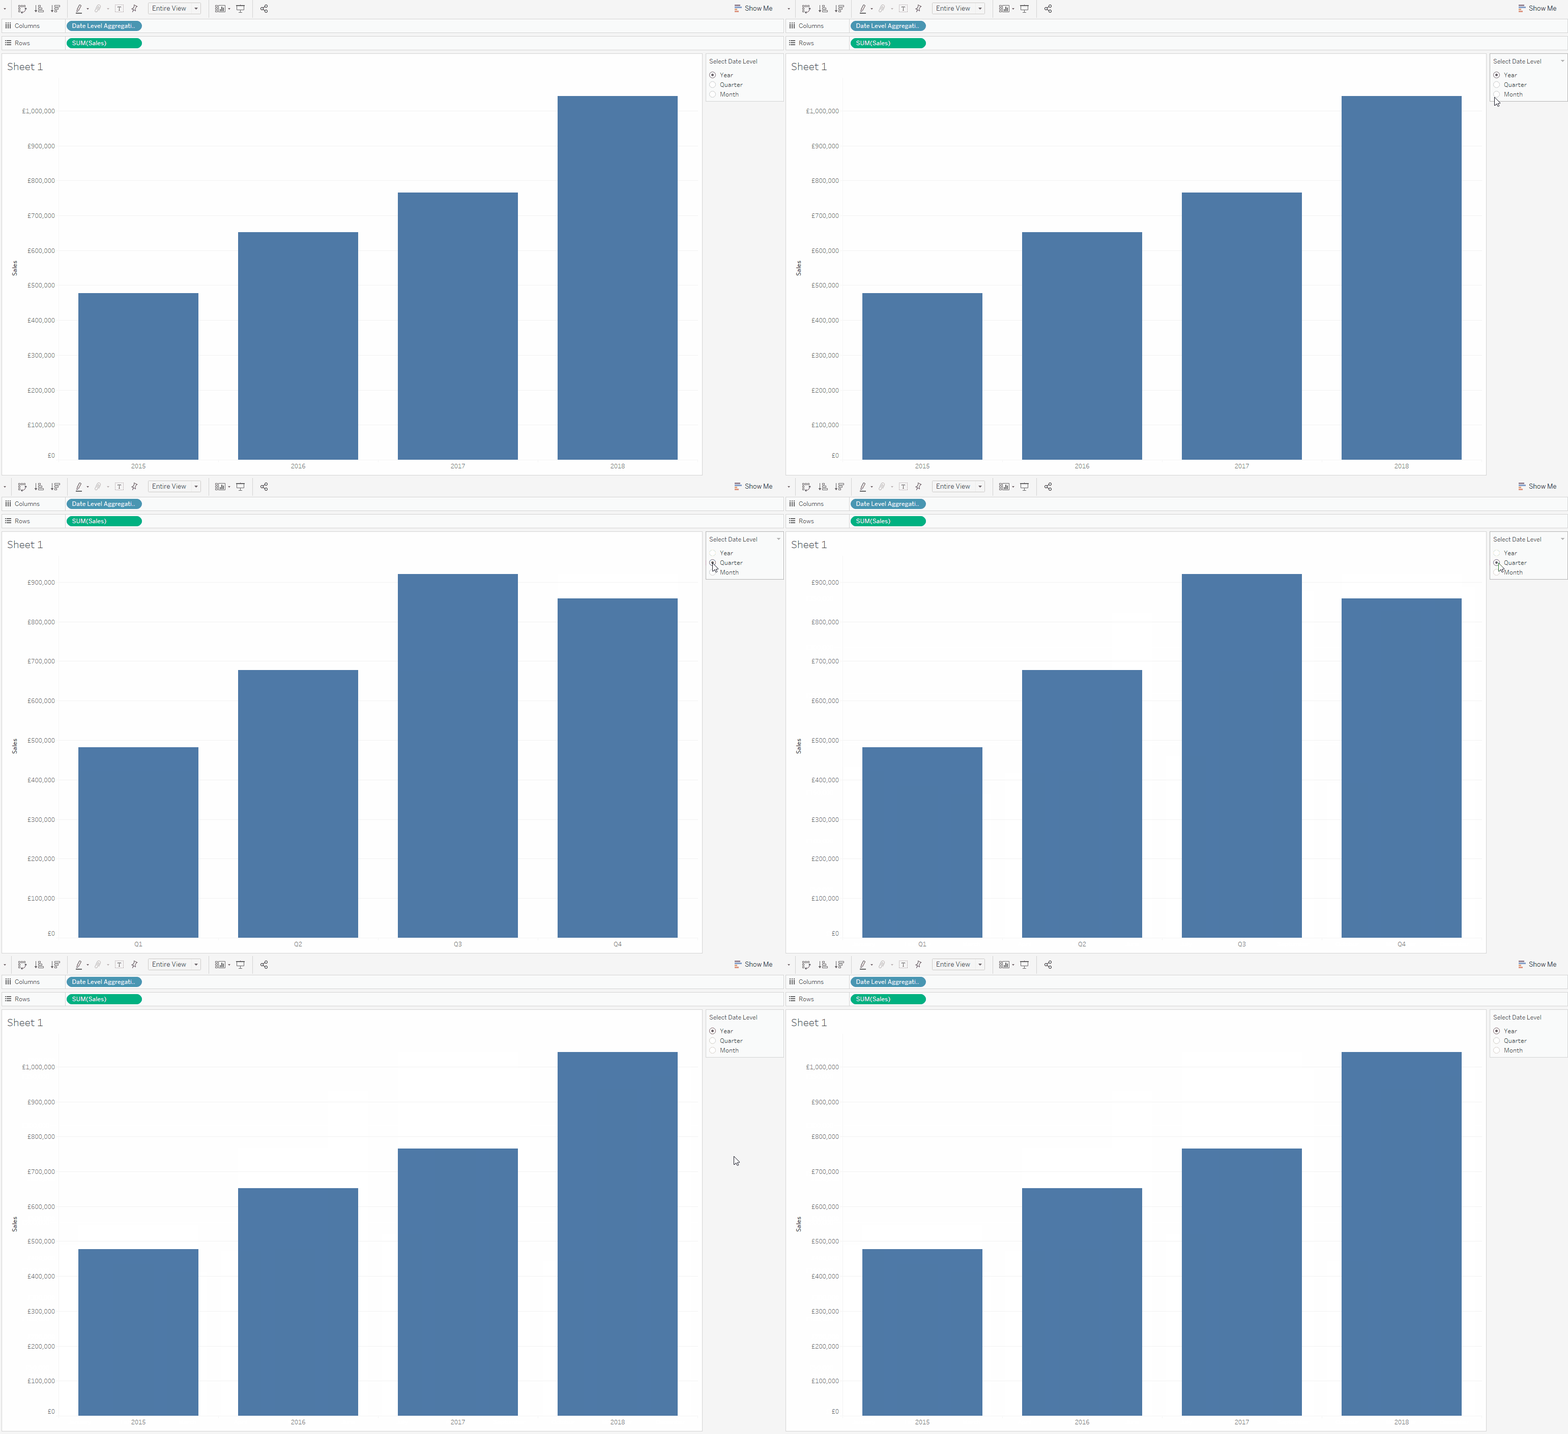
With the updated calculated field, you should get what was advertised. To improve the view, let’s hide the field labels for columns. There you go:

Byeeee!
