Hi everyone! This week we had our first client project, which was a lot. A lot of work but also many learning opportunities. That was one thing in particular that I wanted to share with you. Hence this tutorial.
What we were asked for, was to create a dashboard allowing to explore variables at two levels of a geographical hierarchy. In this scenario, geographical meant map (it isn’t always the case).
First, I approached the problem with set actions. I must stress that I have rather little experience with set actions although if you’re interested in the topic I can recommend Lindsey Poulter‘s blog. Apart from great content and intro to the topic, you can find a link to Lindsey’s workbook which proved super helpful for me.
Now back to the challenge. As stated above, I tried with set actions. It worked but to have the map at the higher and lower level with appropriate tooltips I needed to nearly identical dashboards. The only difference would be the map that I was using. Having decided this walkaround is not optimal (both in terms of performance and amount of work), I seeked help. DS12 was in training with Andy (here are my first two options gone), Carl was nowhere to be found (option three gone)… Thankfully, a few people from the core team were working in the open space of the office. After hearing my weak ‘Help!’ cry, Bethany decided to try and help me. And she introduced me into a super quick solution that now I’m going to share with you!
How To
For the purpose of the tutorial, I decided to rebuild my map trick with Sample – Superstore data so that you can easily follow along.
Create hierarchy. First, we need to have a hierarchy of geographical fields. Let’s use fields State and Region to do that. If you’re familiar with the Superstore data, you’ll know that Regions contain States. It’s a one-to-many relation (one Region contains many States) which is an important point in creating hierarchy.
To create the hierarchy, click and drag the Region between State and Country:


Now you should have the Region field in the Location hierarchy. The problem is, it’s still a string. We need it to be a geographical field. In order to get this sorted, right-click on Region -> Geographical Role -> Create from -> State:

Now the icon next to ‘Region’ should change from ‘Abc’ to a little globe!
Check the hierarchy. Alright, let’s check that we actually have a geographical hierarchy. Double-click on Region, this should result in a map with points on it. (If you have 4 Nulls, go to the indicator in the bottom right corner -> Edit Locations -> change the country to US) Let’s change the mark type to map, the US should be nicely filled with blue colour. To see the difference between regions, we can drag and drop Sales on the Color button:
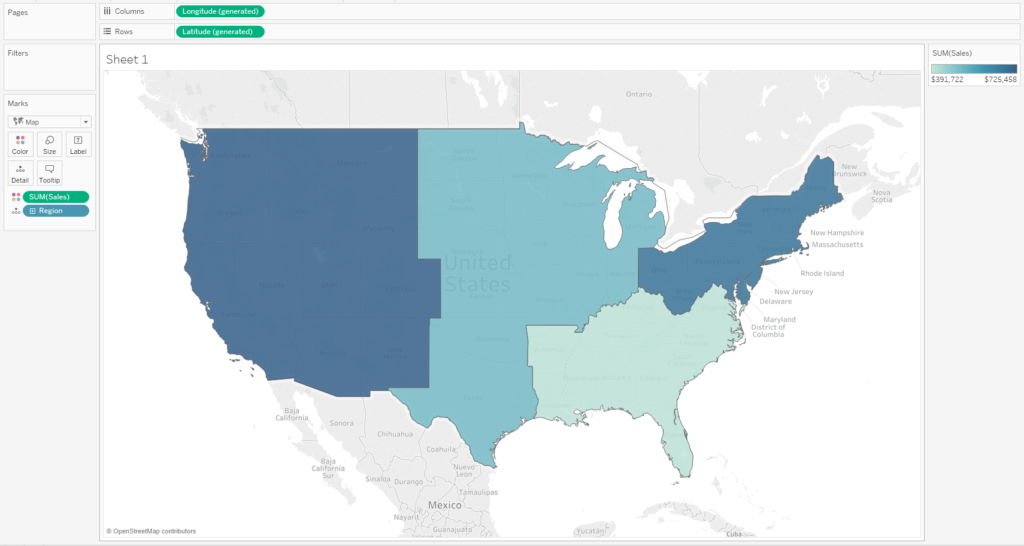
I’m just a tiny little bit pedantic so let’s fix the formatting of the map. Go to Map -> Map Layers

This will open a panel on your left. Change washout to 100% and that will do for now. The map should show now only the coloured areas:
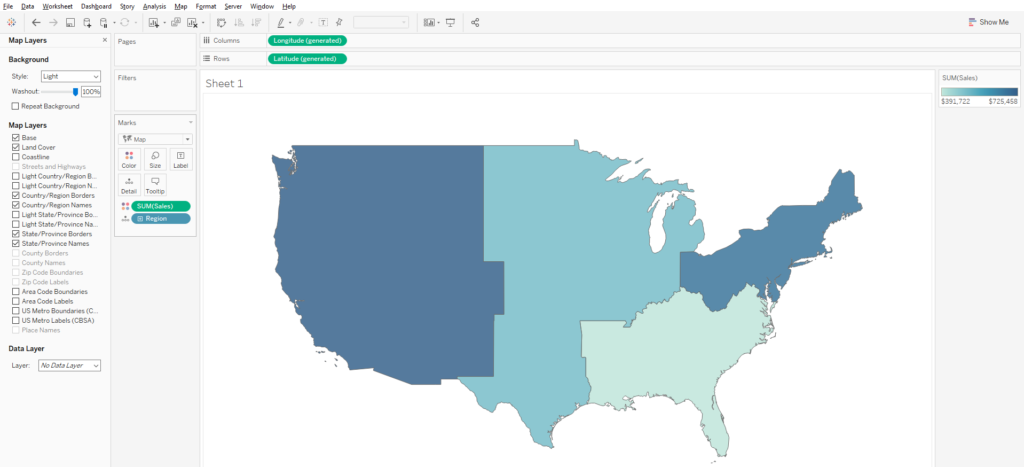
Ok, let’s do the same for States. Before we continue, change the name of the sheet to ‘Region Map’ by double-clicking on the label or right-click -> Rename. Add a sheet and rename it to ‘State Map’. Double-click on State and drag Sales on Color. Then change the washout to 100%:
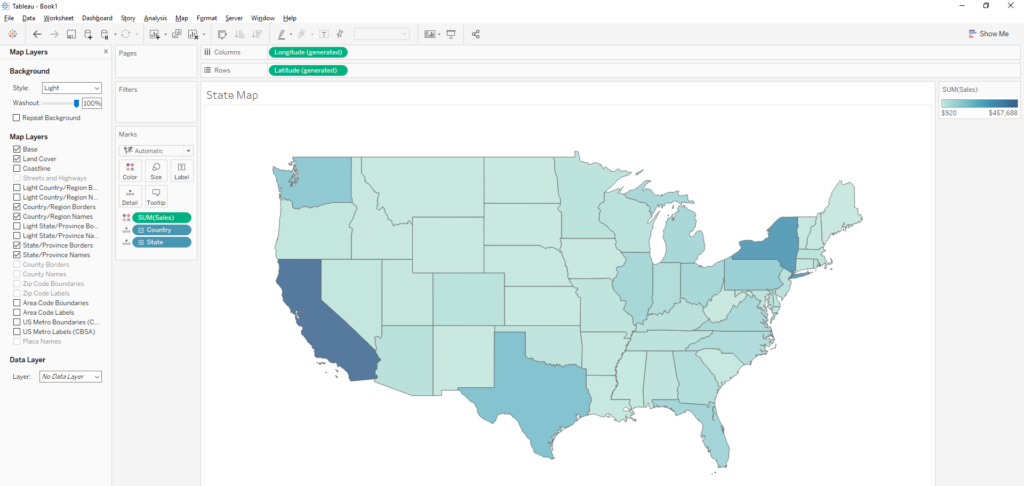
Sweet. Now for both of the sheets, go to Format -> Borders and change Row Divider -> Pane to None and Column Divider -> Pane None this will change it for Headers as well. You’ll have to do it separately for both sheets.

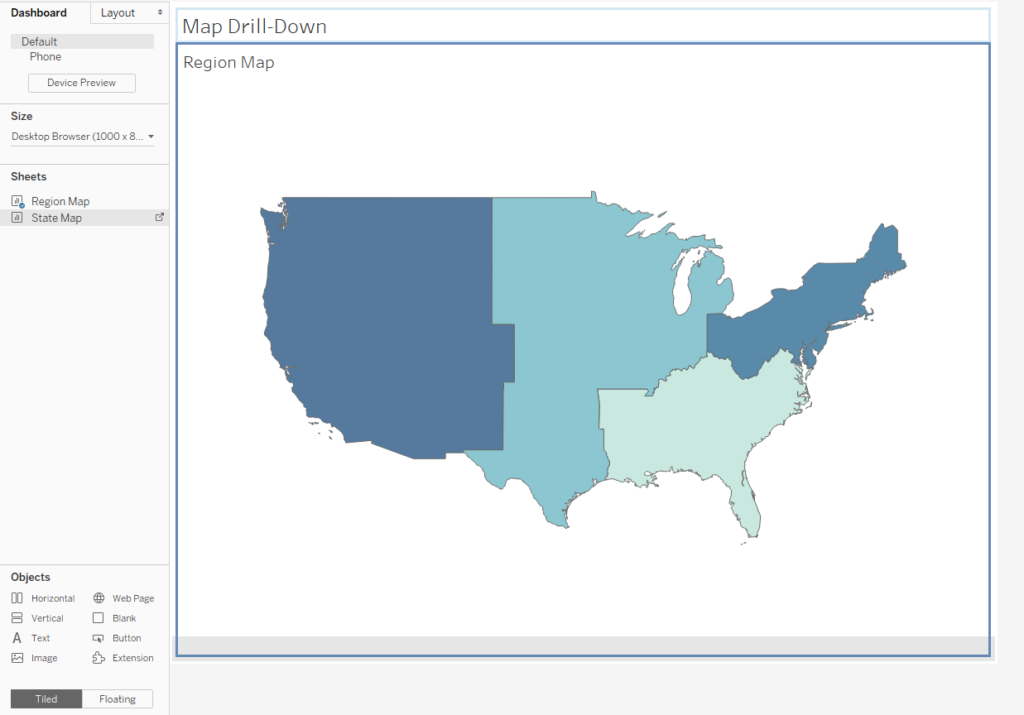
Create a dashboard with a floating container. Ok, now that we have both sheets set up, let’s create a dashboard that will do the drill down. I renamed mine to ‘Map Drill-Down’ and checked the ‘Show dashboard title’ box. We need a container now. I’ll go with a tiled one but you can go with a floating one as well. As for the horizontal/vertical option, it depends whether you want your maps one next to the other or one above/below the other. This is what I dragged onto the dashboard:

To get the sheet into the container you need Tiled to be highlighted and just drag it onto the container. If something’s off, try hitting the Shift key and that should do the trick. Put Region Map sheet into your container and you should see the legend showing up as well, next to the map. If you don’t want it in your view, just click on it and delete (to bring it back, you can click on the sheet -> caret -> Legends -> Color Legend). If you want to prevent the legend from popping up in the first place, just hide the legend in the sheet view.
Ok, now you should have something similar to this:
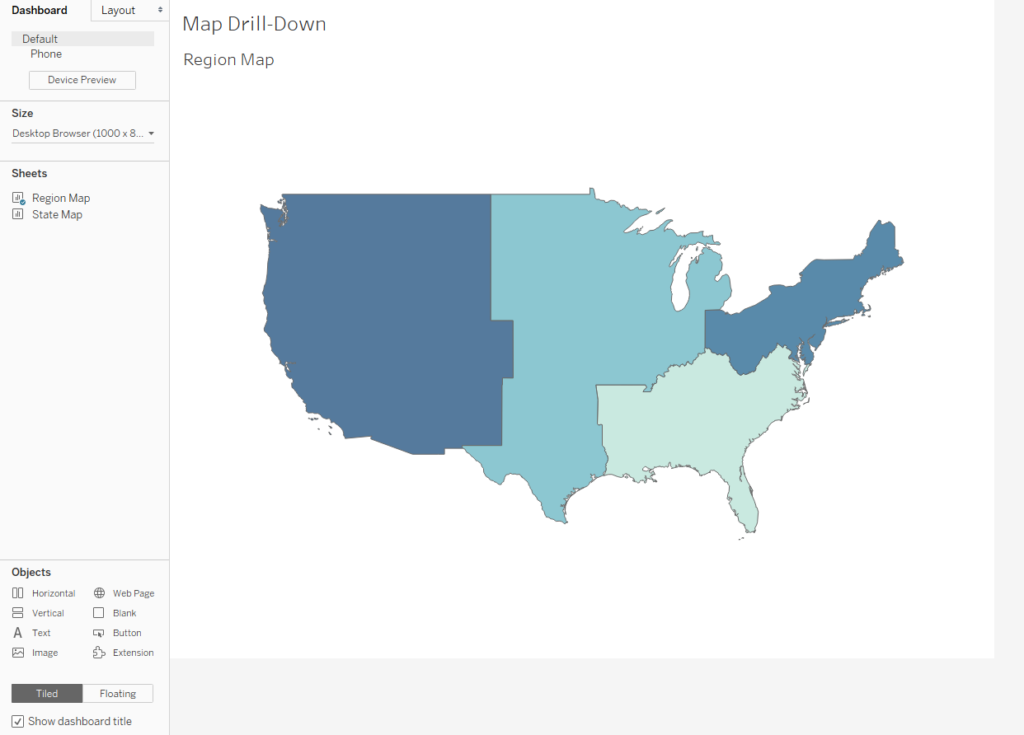
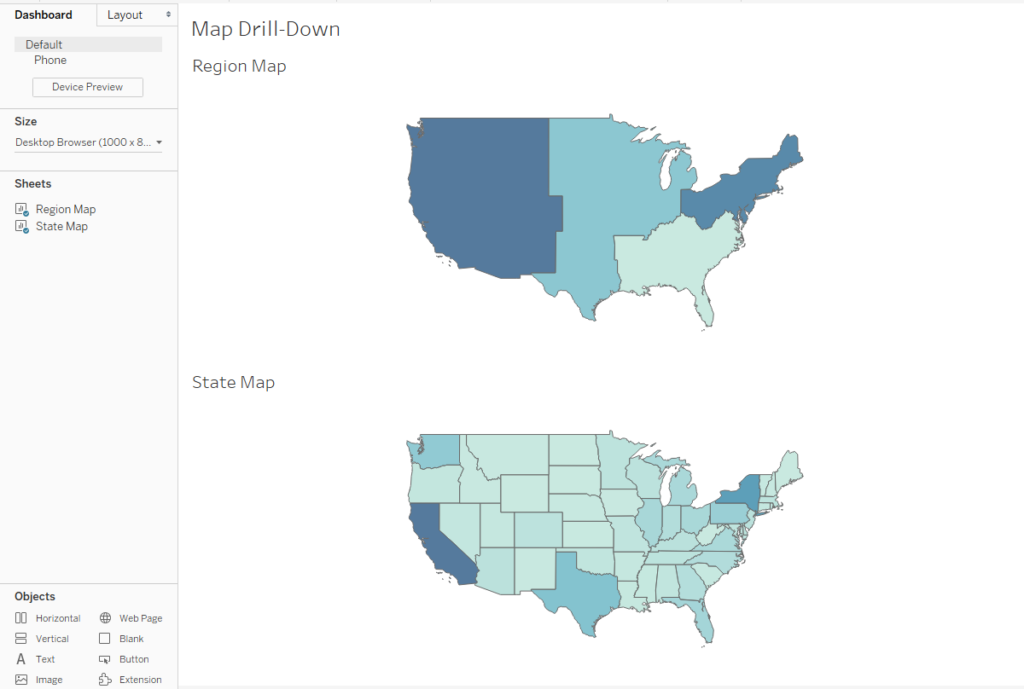
Drag the State Map to the bottom/right side of the container (depends whether you choose vertical or horizontal container):
This is what your dashboard should look like:
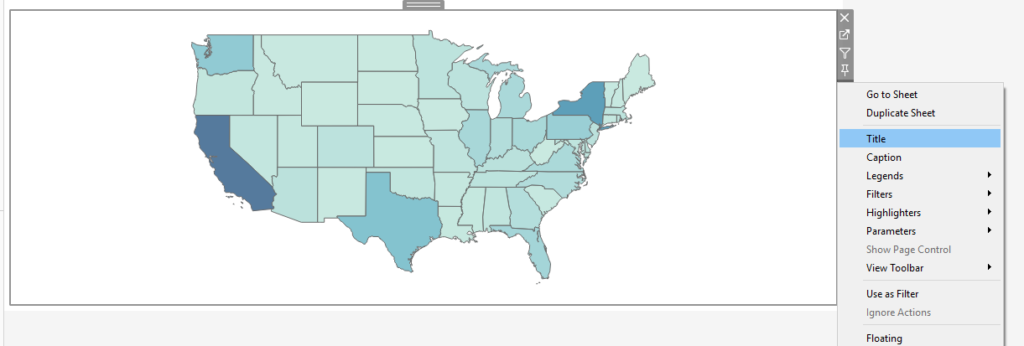
Now, hide the title for the State Map sheet. Make sure the Title is unticked:
Ok, now the party begins! Go to Dashboard -> Actions -> Add Action -> Filter. Change the name of the filter to Map Drill Down (this will make the action easier to identify). Set ‘Run action on’ to Select. In source sheets, make sure that only Region Map is checked and in the target sheets only State Map is checked. You can change that if you want your action to work on more things. The final change is to set ‘Clearing the selection will’ to ‘Exclude all values’:

Hit OK, and once more. And there you go! You have a drill down map. How cool is that?
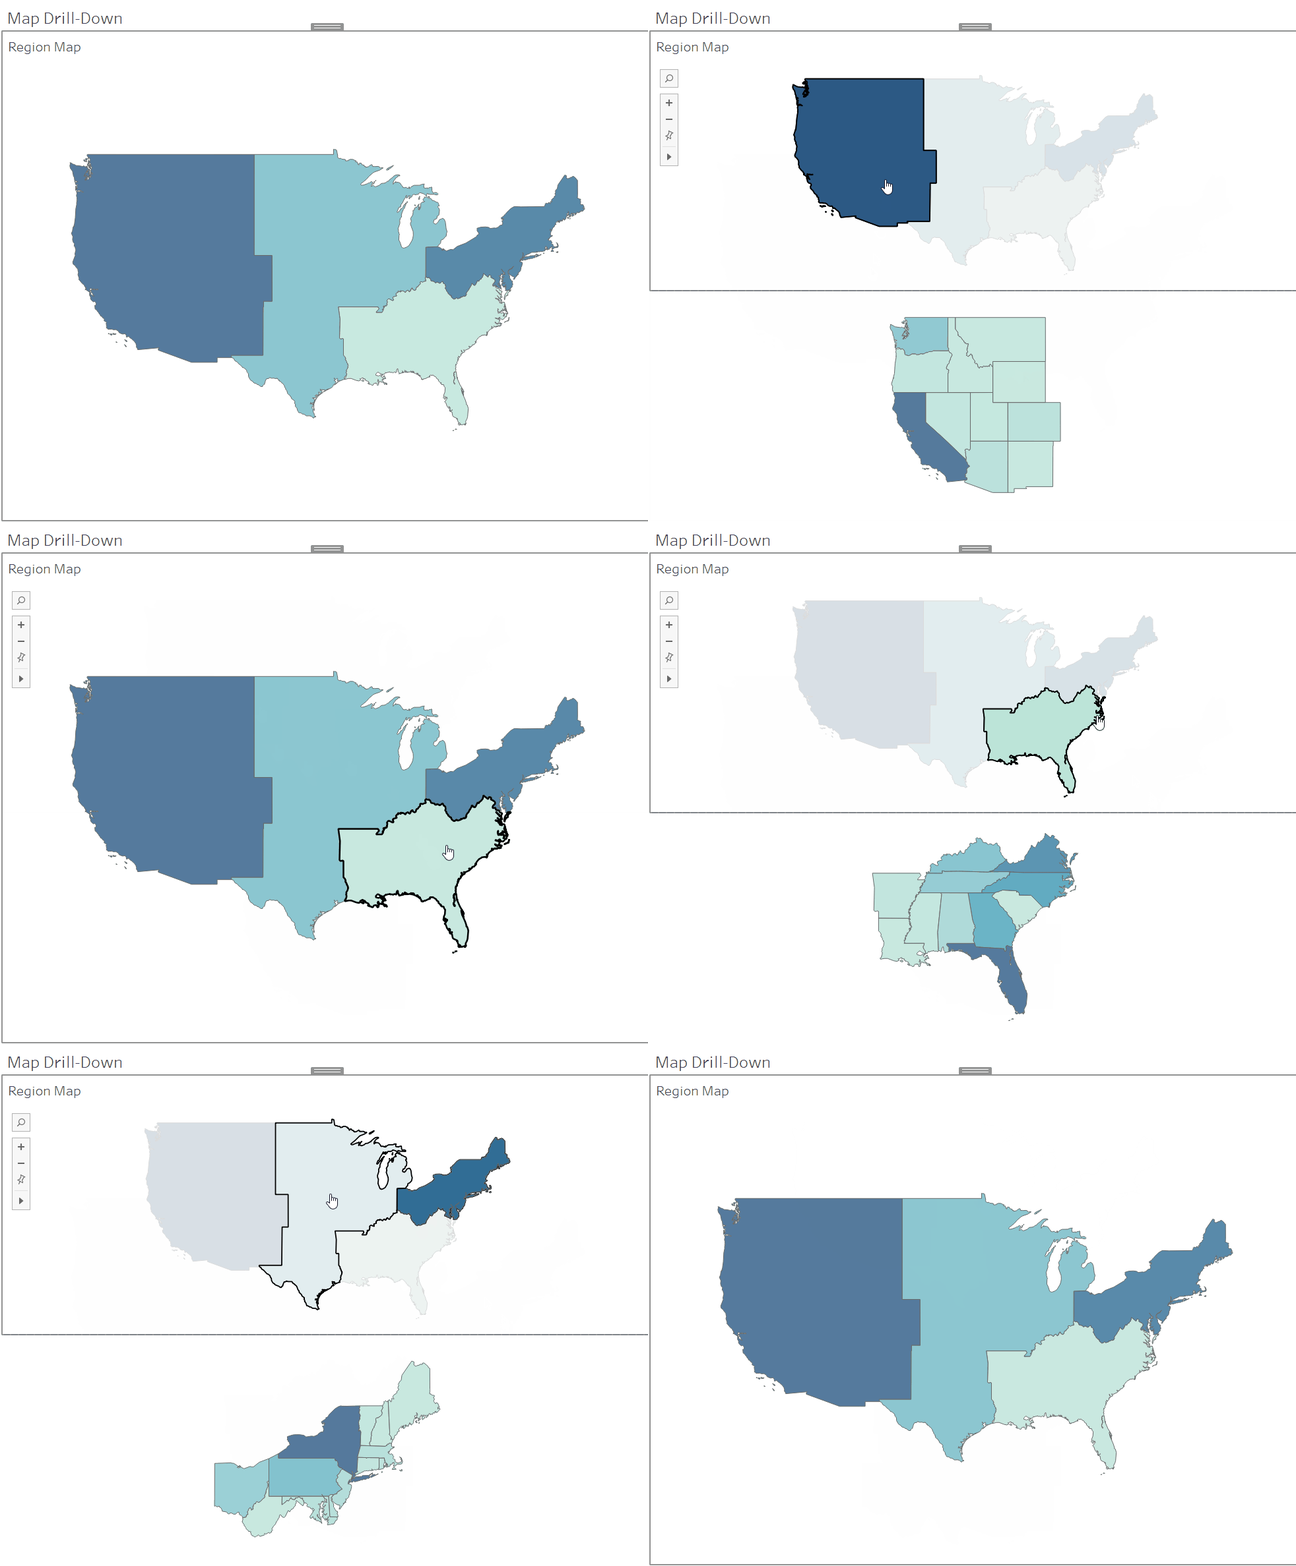
Because they’re on different sheets you can have different tooltips for different levels. Also, you can add more levels! This, however, can make things slightly more confusing for the users, so be careful with that. (If there’s interest in a post on adding more levels, e.g. cities, let me know on twitter or via any other route. In case there’s anyone interested in seeing that, I’ll write a follow-up!)
Check out my workbook with the map here.
Well done for getting to the end of this tutorial! Byeeeee!
