I was asked recently how I made one of the charts in my UK Bicycle Thefts viz (shown below) and so I have decided to write about how to create one.
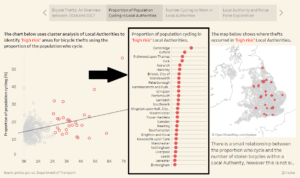
Now this chart I haven’t found a name for officially, I quite like Abacus chart or perhaps a Slide chart. Personally, I think it is a great way to visualise percentages within a number of categories. If you would rather watch a video of how to create this chart please skip to the bottom of the page by clicking here.
To create this viz I am going to use some fairly simple data for illustrative purposes however you can use any data that you want to present as a percentage.
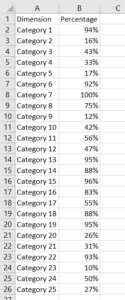
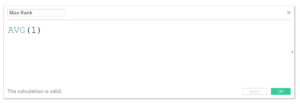
The way we are going to build this chart is by creating a dual axis chart (layering one chart on top of another) – one as a Circle and the other as a Gantt. The first thing we need to do is create two fields: Max Rank and Gantt length. These are going to allow us to draw the thin line which represents 100%.

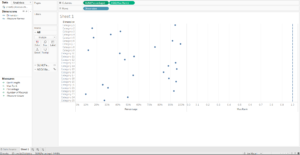
We want to add the Max Rank onto the columns along with the Percentage (of whatever is in your data) as well as adding in your different categories. The results from my data are shown below:
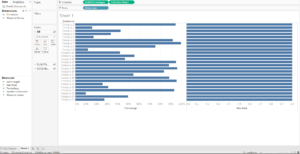
Next we change the ark type of the Percentage to a Circle and the Max Rank to a Gantt.
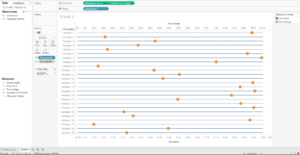
On the Gantt marks card we add in the Gantt length field to the size shelf and make this as small as possible. The reason that this is -0.99 is so that the line created by the Gantt doesn’t touch the y-axis which provides some welcome space in the final visualisation.

Next, you make the chart a Dual axis and synchronise your axes. You will also want to put the Measure names field onto the colour tab on the All marks card if this does not happen automatically.
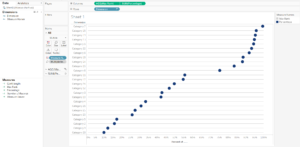
You now have your Abacus chart and you only have to touch up some of the formatting to finish it off. I like to go with a light grey for the lines as this is only for reference, the eye should really be drawn to the circles representing the percentage. In addition, I find these easier to read when you order on the percentage, your eye can get a little lost otherwise.
Video:
