


This week at the Data School we had Dan Raines come in and speak to us about the conversations he has with Information Lab customers and some of the things that we should expect when we go out on placements. He also happened to tell us that he doesn’t like dashboards…

Fortunately Andy was not in the room at this point so we didn’t have to call the police, but Dan did make a very valid point: ok your dashboard looks good, so what? Or in other words – what is it telling me?
It is all well and good having a number of different fancy charts or using really complex calculations which would leave most Tableau-heads crumbling if they tried to recreate them. It is so important to remember that you need to see your work from the users perspective. At the end of the day you are not going to be sitting next to the user when they are looking at the dashboard (maybe in a business setting initially) but it still needs to be simple and intuitive enough to stand on it’s own two feet. As the developer it is you duty to guide your user through the story and meaning that you want to convey. Having said that, Tableau is very much a data exploration tool and that shouldn’t be taken away from the user completely.
So here is my number one tip when it comes to dashboard design as it is something that has helped me tremendously over the past few weeks: make the title of your dashboard a question. The title is the first thing the user sees and it is your way to engage their mind for following the story that you are telling. An amazing book for this sort of thing is “Thinking Fast, and Slow” written by Nobel Prize winner Daniel Kahneman. This is not a data book, but lets you see into the workings of how people think and this will undoubtedly change your approach to dashboard design.
Back to the title, lets look at an example:
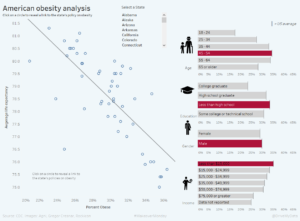
In this version of the dashboard the title is “American obesity analysis”. As a user you kind of go: “Oh right ok, looks bleak” *moves onto next viz*.
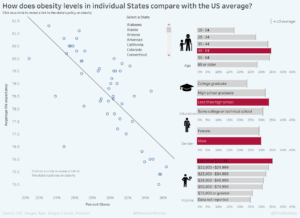
However, the second version does show a question title and this will automatically change the users attitude to the visualisation. Especially if the user in this case is American and they want to see how their State compares. Previously however, they may have skipped past it.
To emphasise again, when you complete a viz question yourself. So what? What is the point I am making? Do I convey this meaning to the user? My advise is to use the title as the beginning of your story, and the rest will flow from their.
Thanks for reading, if you would like to leave any comments or ask any questions please do not hesitate to get in touch through my twitter account.