So in the first two episodes of this series looked at Table Calculations and Level of Detail Calculations. But what do they all mean and what significance do they have within the murky realms of Tableau. The reason we have things such as these is to manipulate the ‘Order of Operations’.
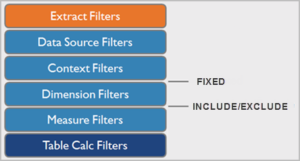
From this we read top to bottom and this is the order that Tableau will process our commands. Extract filters and Data source filters are fairly similar, I like to think of these as filtering the data before you start exploring it in worksheets and dashboards ie data filtered wont show in your bar chart or table etc.
Next we have the Context filters. You may have seen these before and are the the grey pills which will look something like this:
No context filter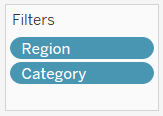
Context filter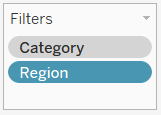
Two things to note here: The Category pill which we have assigned to context has turned grey and it has also moved above Region which is a visual que to let you know that the Category filter is applied first.
Then we have our Dimension filters, these are (in most cases) the blue pills and are discrete (field entries are individually separate and distinct). After that we have our Measure filters (usually the green pills) and are continuous (normally a number or date and will include all values between the start and end points).
Finally we have our Table Calculations as covered in Episode 1.
Now the eagle eyed amongst you may have noticed that I skipped the Fixed, Include and Exclude filters on the right of the above diagram, these are the Level of Detail Calculations. In Episode 2 we looked at translating Fixed LODs – these fit into the Order of operations between context and dimension filters. The include and exclude LODs fit between the Dimension and Measure filters.
But what does this mean in practice? Lets look at an example where I want to look at the average sales for a number of individual sub-categories within a segment compared to to the overall average sales for that sub category. It will look like this:
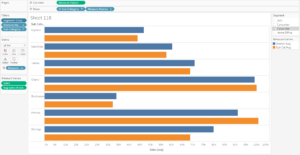
I have excluded some of the sub-categories so that the view isnt too busy to make my point and have also only want some of my Measure Names. My Sub-category average calculation is a fixed LOD and looks like this:

From Lesson 2 – “For each Sub-Category give me the average sales”.
Now look what happens to the viz when I add Segment to context:
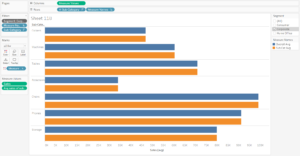
By putting Segment into context, tableau is skipping the LOD and initially filtering segment (to corporate in this example) before calculating the average sales for each sub category. In short, we dont need the context filter in this example.
Now for an example where we do need a context filter. In this example we want to look at the top products within each category by sub-category:
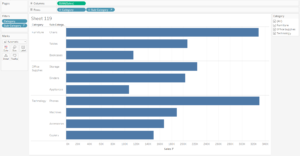
I have a top 10 filter on this viz and if I filter to furniture I dont get the top 10 within furniture:
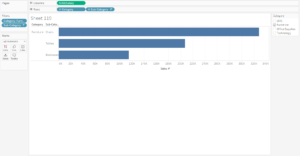
As ‘Furnishings’ is not in the top 10 of all sub-categories this is not shown in the view. To show this we need to put category into context:
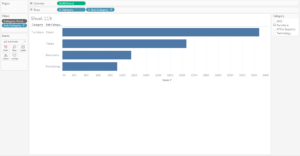
And there you have it. As we can see the Category pill is grey which means it is in context and Tableau does this filter action before it applies the Top 10 filter (which is a Dimension filter).
If you have any questions or would like to leave any comments please do so via my twitter page.
