This guide follows on from https://www.thedataschool.co.uk/john-power/creating-a-comparison-range-based-off-of-chosen-month-range/ in which we calculate our 'Sales for Comparison Month Range'. We will also need 'Sales for Selected Month Range' which we calculated in
As with the previous guides, we will be using the US Superstore Date Set and some of the calculations mentioned here were created and explained in the previous two guides.
The process will be broken down into 4 sections:
- Creating our % Difference Between Selected Month Range Sales and Comparison Month Range Sales
- Creating our Start Month for Comparison Range to Display
- Creating our End Month for Comparison Range to Display
- Add to the BAN
Creating our % Difference Between Selected Month Range Sales and Comparison Month Range Sales
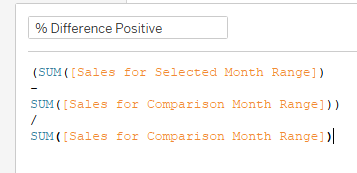
Firstly, we need to calculate our Difference Between Selected Month Range Sales and Comparison Month Range Sales, we can then convert this to be displayed as a percentage:
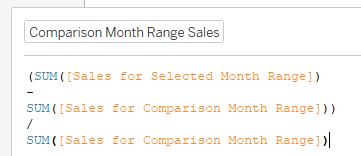
Note that for this calculation we need to aggregate our data. To do this we wrap each calculation in SUM; this way we are looking at the data as an overall figure, rather than row by row (the figure for each of the individual months).
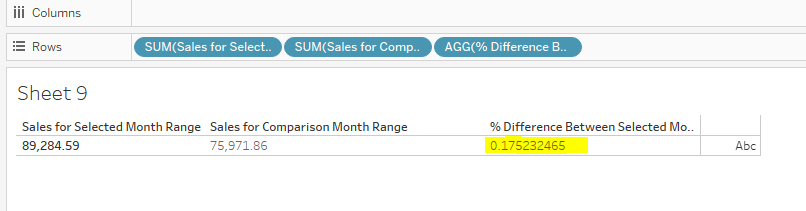
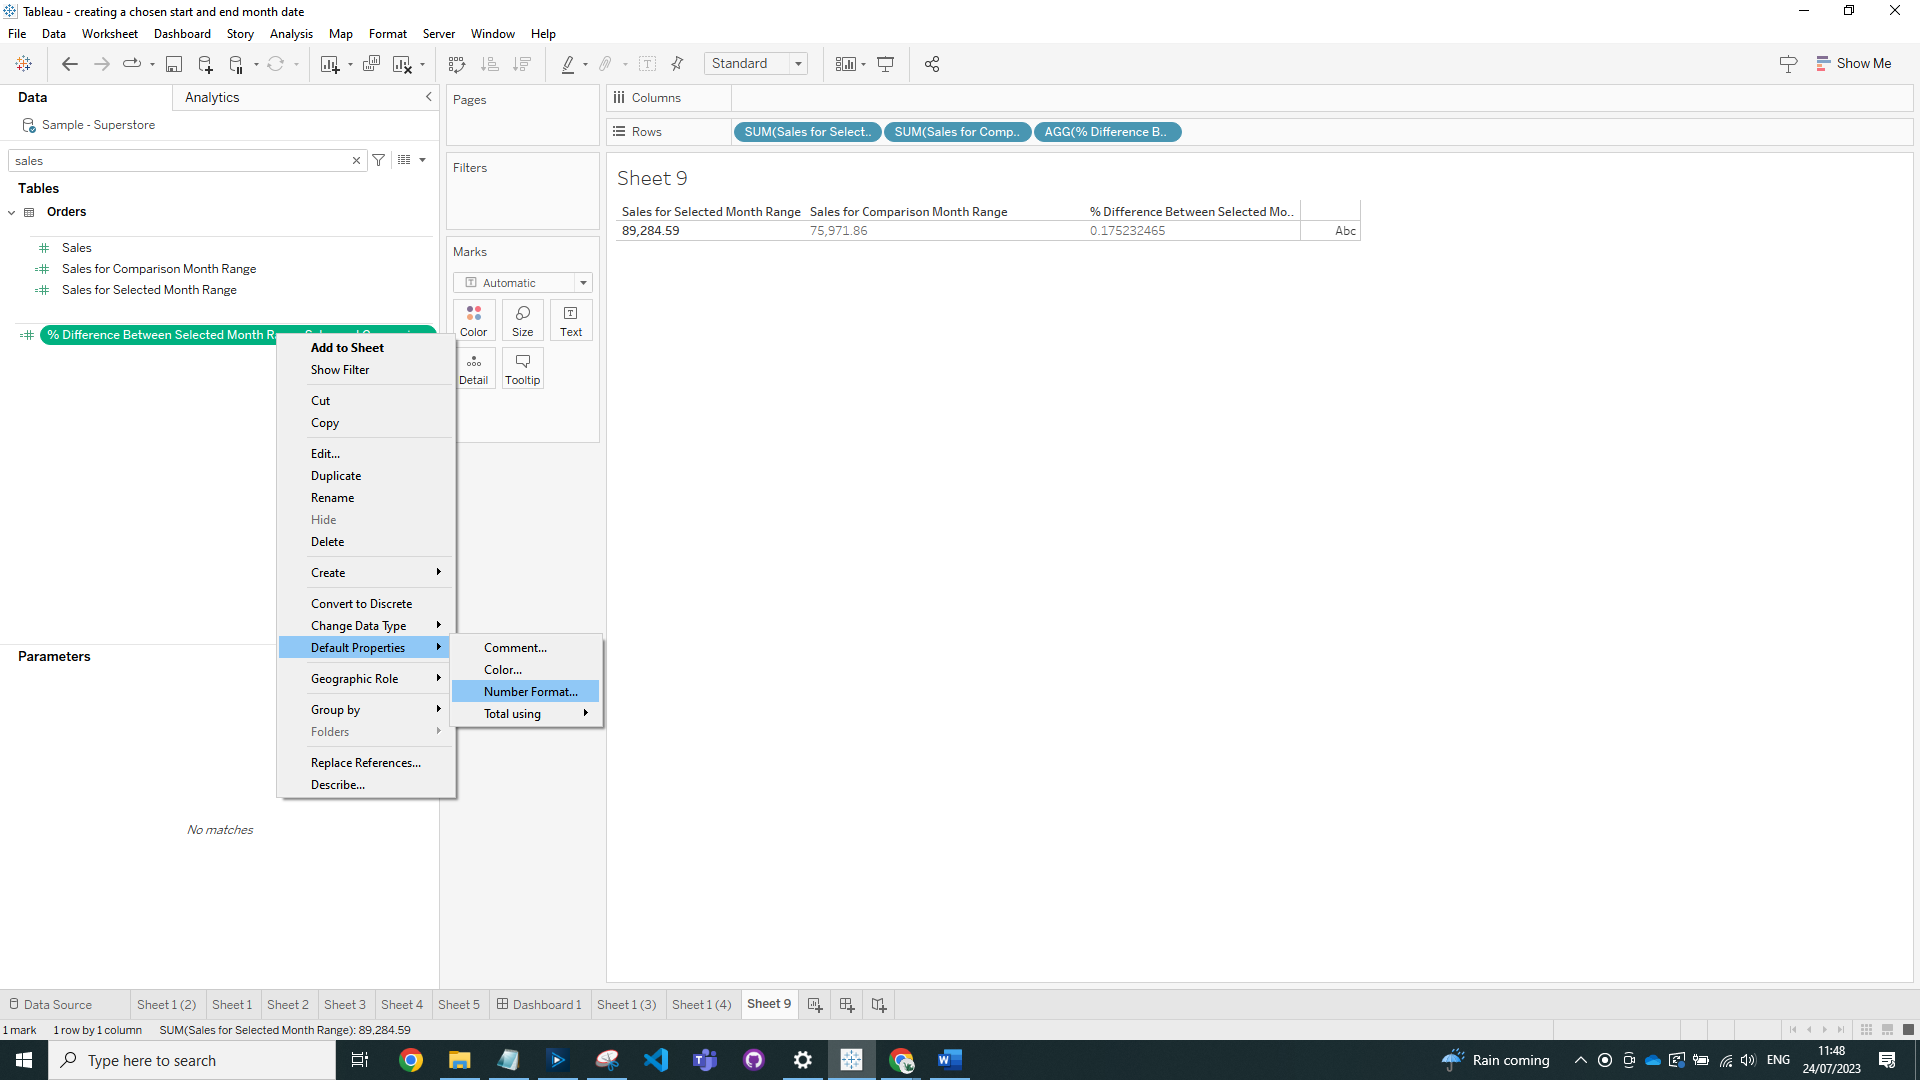
When we first drag this onto view it will display as a number:
In order to convert this to display as a percentage, right click on the calculation and under 'Default Properties', select 'Number Format':
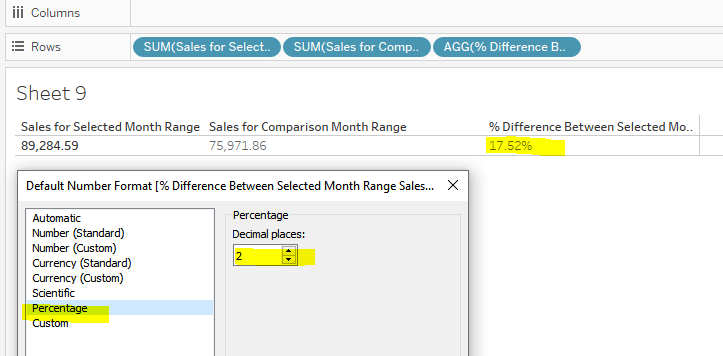
Now we can update our calculation to display by default as a percentage with two decimal places:
Creating our Start Month for Comparison Range to Display
Now we have our percentage difference, we want to be able to show which months we are comparing this change to. First off we will create our 'Start Month for Comparison Range to Display':
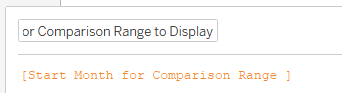
All we need to do for this is copy in our 'Start Month for Comparison Range' and then go to the 'Default Properties' menu as we did before, select 'Date Format' and choose the below:
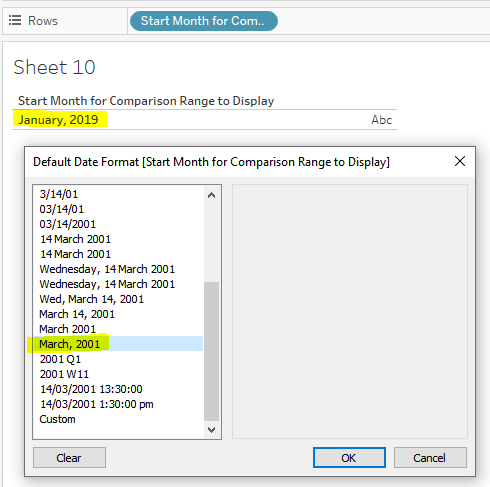
When we drag this onto view we can see that is is displaying as expected.
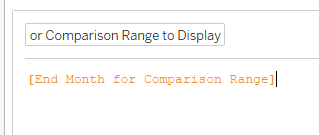
Creating our End Month for Comparison Range to Display
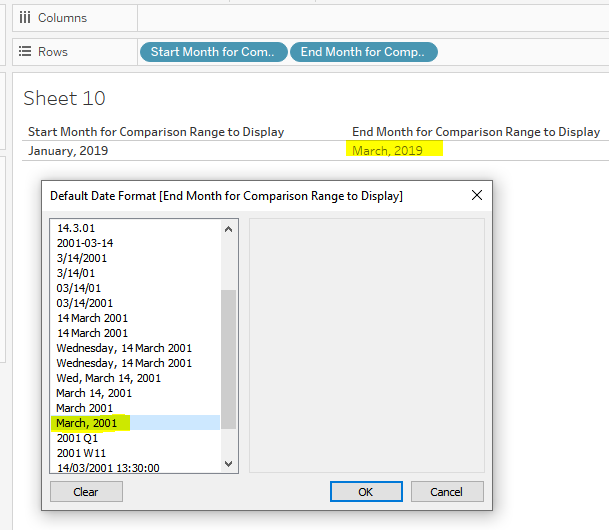
Now we will do the same for our 'End Month for Comparison Range to Display':
and format in the same way:
Adding to the BAN
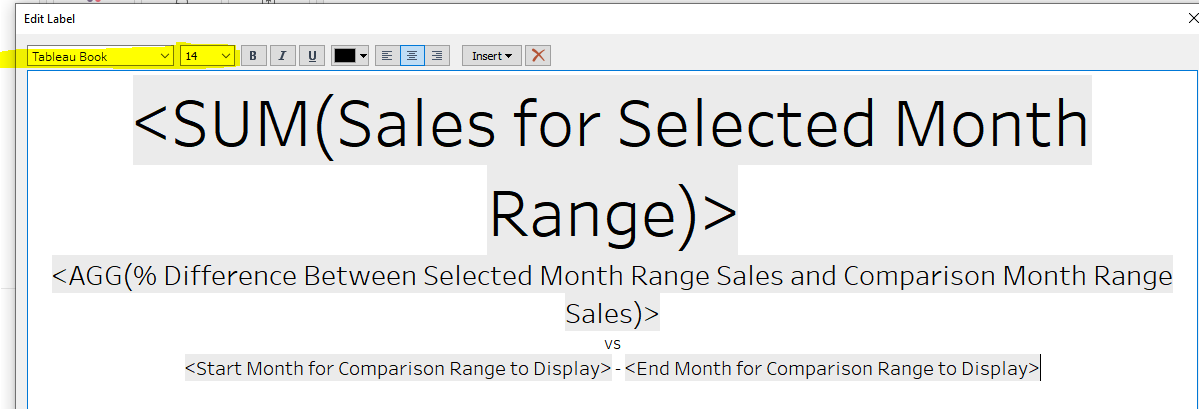
Now we want to be able to display this percentage change alongside our SUM of Sales for our selected range BAN. First, we would need to add both the 'Sales for Selected Month Range' (as a SUM) and '% Difference Between Selected Month Range Sales and Comparison Month Range Sales' (as AGG), 'Start Month for Comparison Range to Display' and 'End Month for Comparison Range to Display' onto our 'Text' marks card. We can then use the font and font size options to format as required:
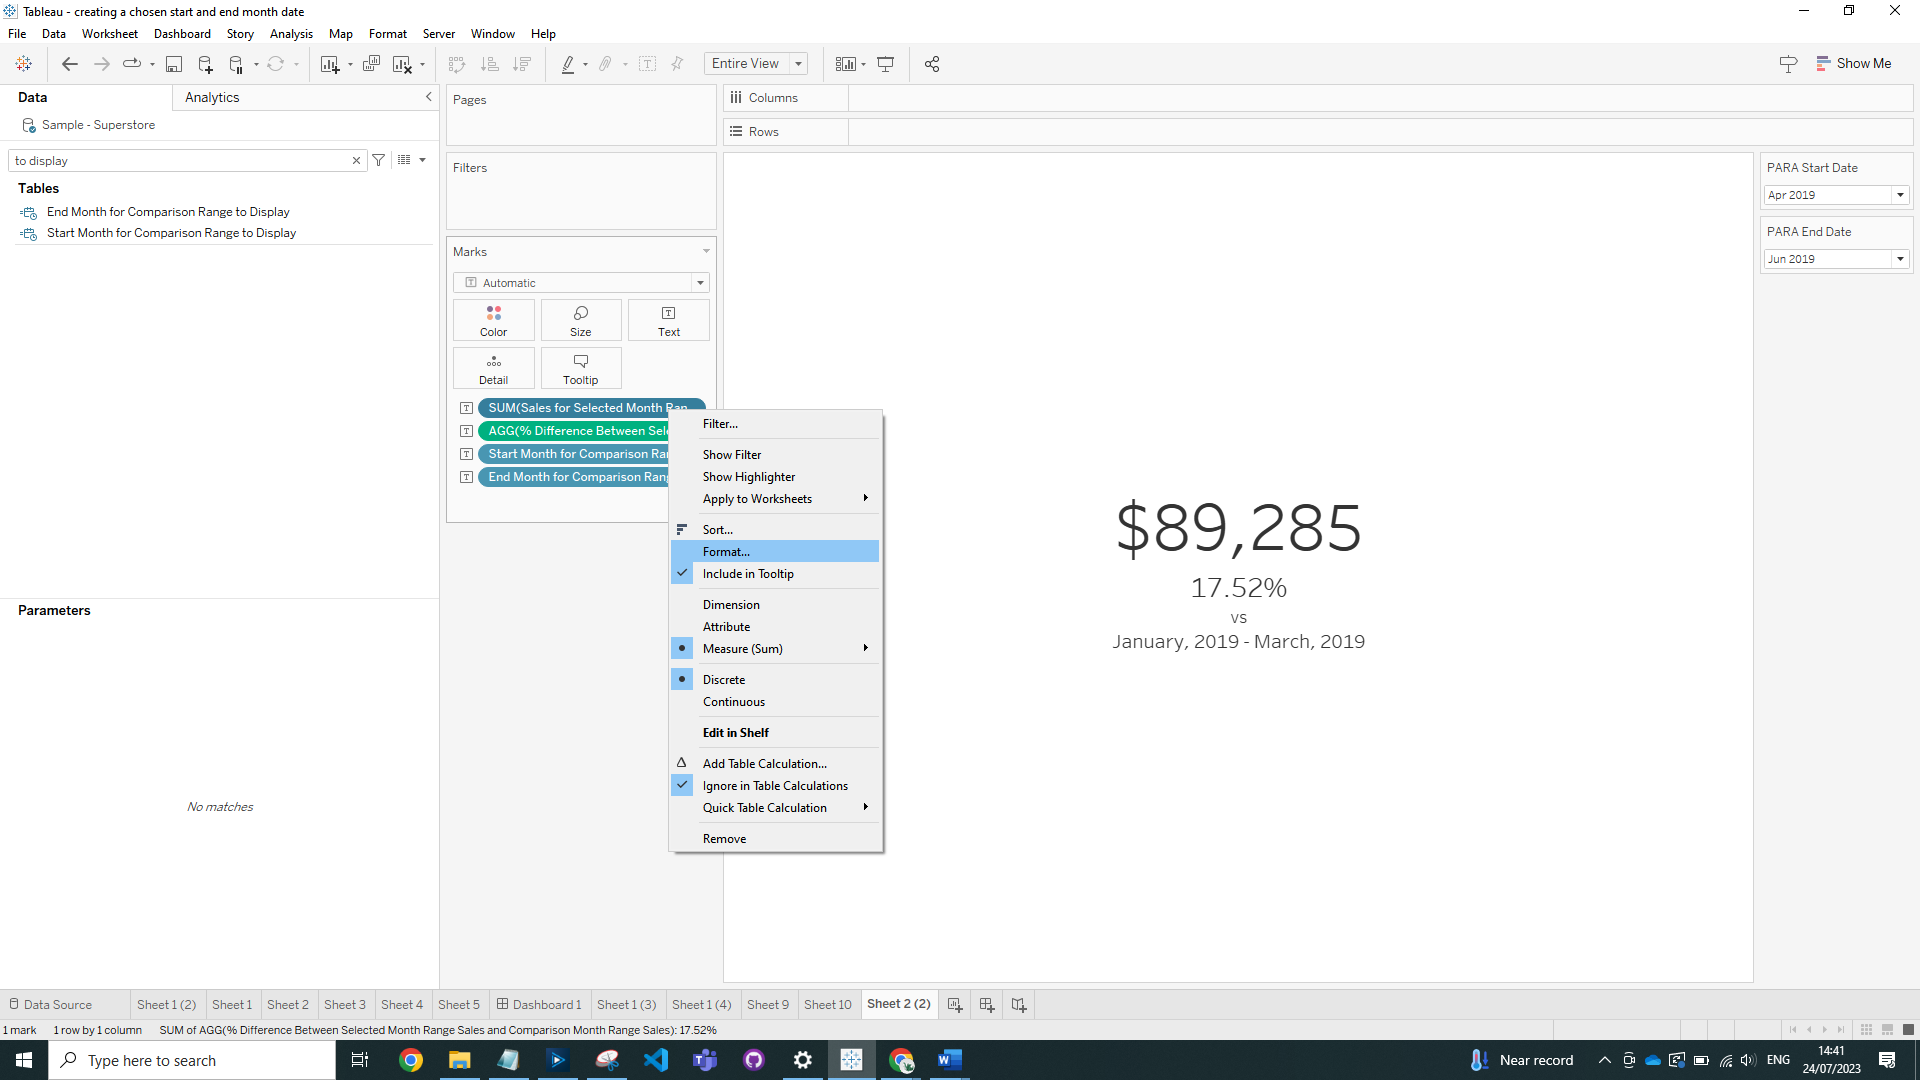
We are also able to format how each value is displayed by right clicking on each pill:
Using the color and shape options available within Tableau we can draw more attention to the '% Difference Between Selected Month Range Sales and Comparison Month Range Sales'.
To do this we will need to create the below calculation.
'% Difference Positive':
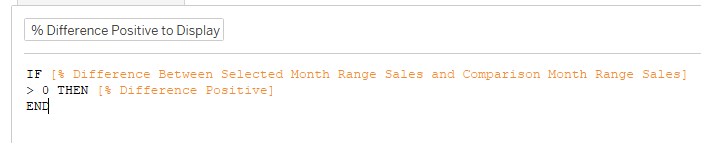
'% Difference Positive to Display':
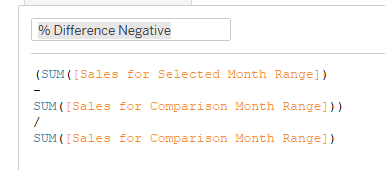
'% Difference Negative':
'% Difference Negative to Display':
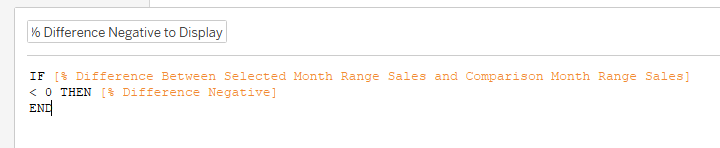
These calculations are used to identify if the percent different is positive or negative. We need to split these out to be separate so we can later format them independently.
Now we need to create our 'Arrows to Display':
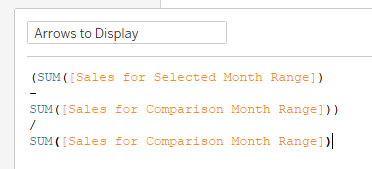
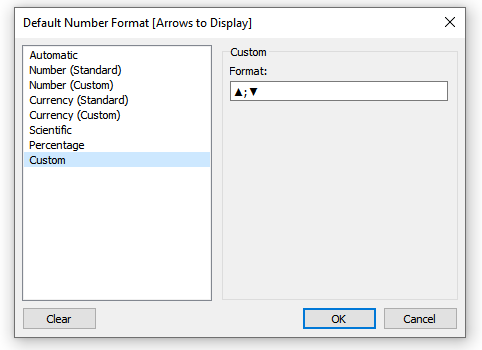
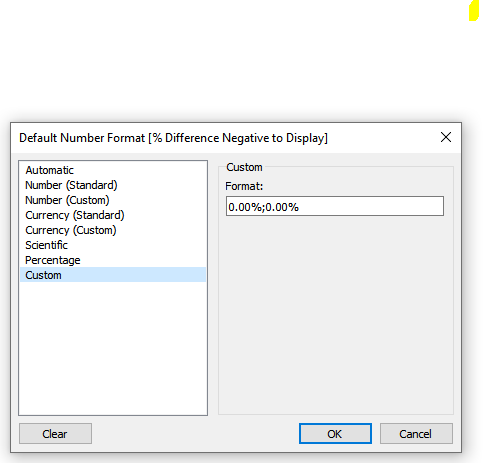
For this calculation, we will need to change the Default Number Format so that an up arrow shows for positive (copy from here if required ▲) and a down arrow for negative (copy from here if required ▼):
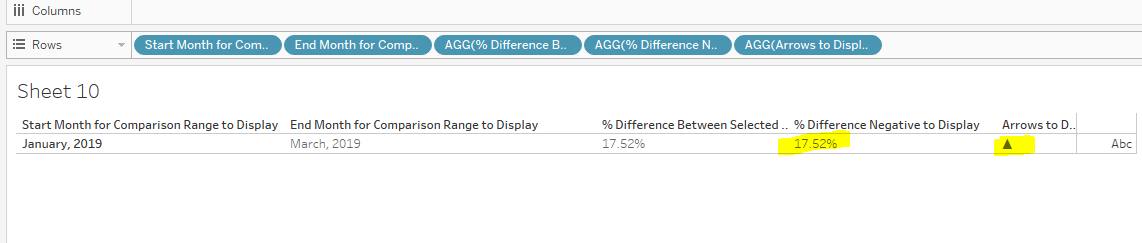
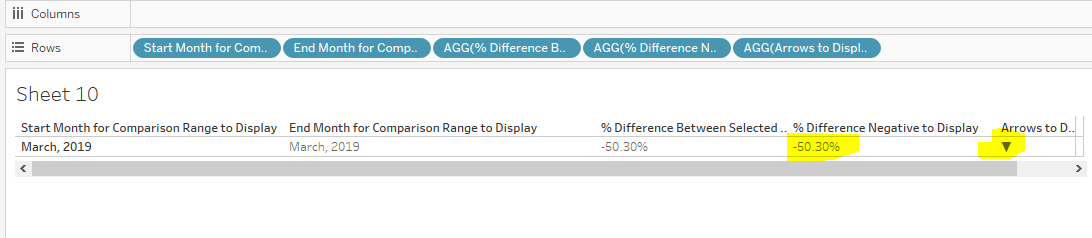
If we drag this onto view, we can see the arrow change according to the positive or negative number:
Now we will need to update the Default Number Format for '% Difference Positive to Display' and '% Difference Negative to Display' and remove the minus mark for negatives:
If we drag both '% Difference Positive to Display' and '% Difference Negative to Display' onto view, we can see that the positive display only shows for positive, and the negative display only for negative:
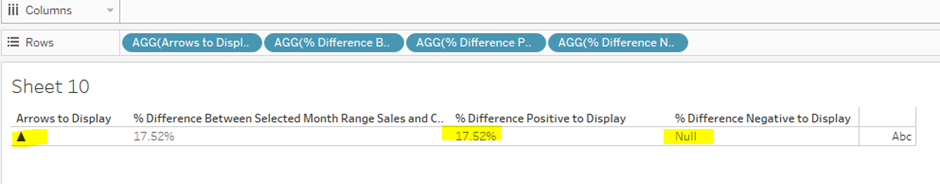
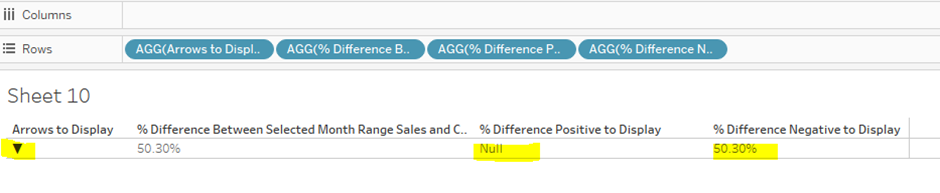
Do not worry that we have NULLs showing, once we are finished this will not be an issue.
Back on the BAN, we now need to remove '% Difference Between Selected Month Range Sales and Comparison Month Range Sales' from the 'Text' Marks card, and add 'Arrows to Display', 'Sales for Comparison Month Range', '% Difference Positive to Display' and '% Difference Negative to Display'. Format as below:
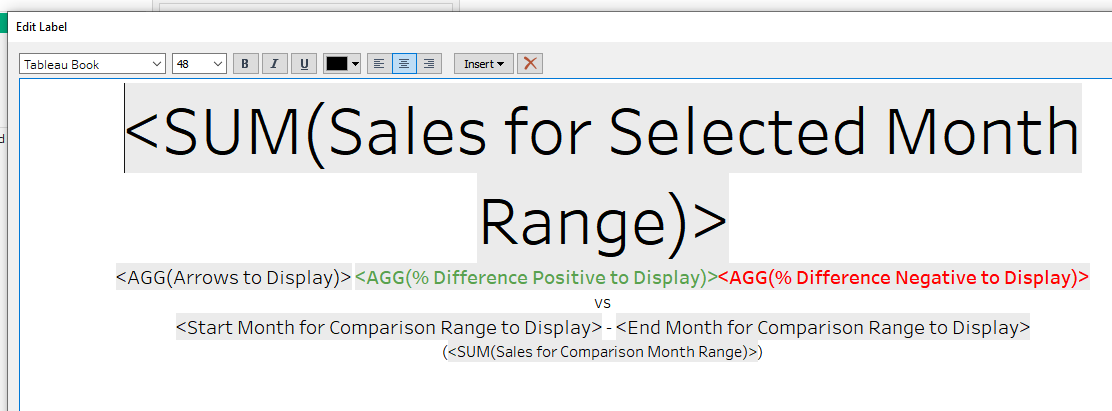
We will color '% Difference Positive to Display' and '% Difference Negative to Display' green and red respectively to draw even more attention to the percentage change on view. By placing these two calculations next to one another with no gap, it will only show the value that is not NULL.
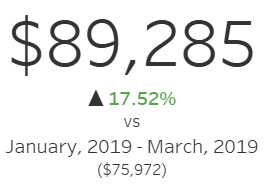
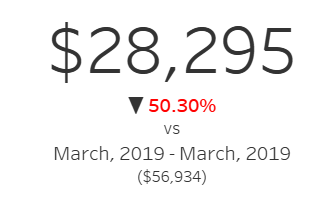
Now our BAN and comparison percentage difference change is complete: