


In this blog I will try to explain the different types of cardinalities possible in Power BI by creating a snowflake schema and show how this affects cross filtering.
The Data
In this blog, I will be using holiday data. I have 4 tables that I would like to link together.
Table 1: Each airline and the destinations they fly to

Table 2: Who flew with each airline and where they started

Table 3: How much each customer paid for their flight

Table 4: Star rating reviews left for each airline and their HQ Offices

I want to link these tables together so I can answer some key questions and gain more insights from my data.
Power BI
There are a few different ways of creating relationships in Power BI.
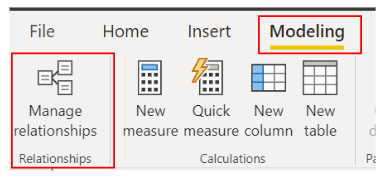
1) Navigating to the "Modeling" tab and then selecting "Manage Relationships" > "New" or you can edit an existing relationship by selecting the relationship and then "Edit".
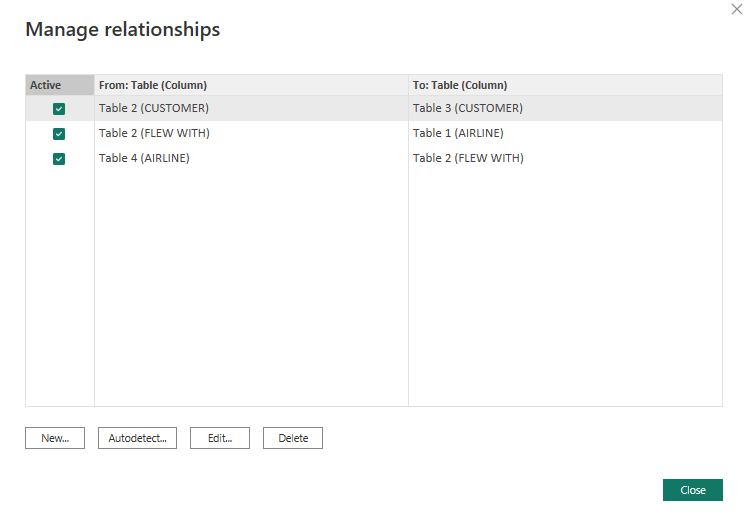
Power BI does have an Autodetect option which can be useful for new users. With this feature the user does not have to manually create the relationships between their tables, Power BI will create them for you. However, Power BI cannot determine for certain if there IS a relationship between tables or not so occasionally you do have to edit the relationship it has made for you and manually configure it yourself.
2) Clicking the linked tables icon in the ribbon on the far left will take you to the data model view. You can then drag matching columns from the tables you would like to link on top of each other and Power BI will automatically create a relationship using its autodetect feature. However if this relationship hasn't been computed correctly you can right click on the connection between the tables and either delete it and do it manually using the above method or select the "Properties" option and edit the configuration as you like.

Many-to-1 Relationships
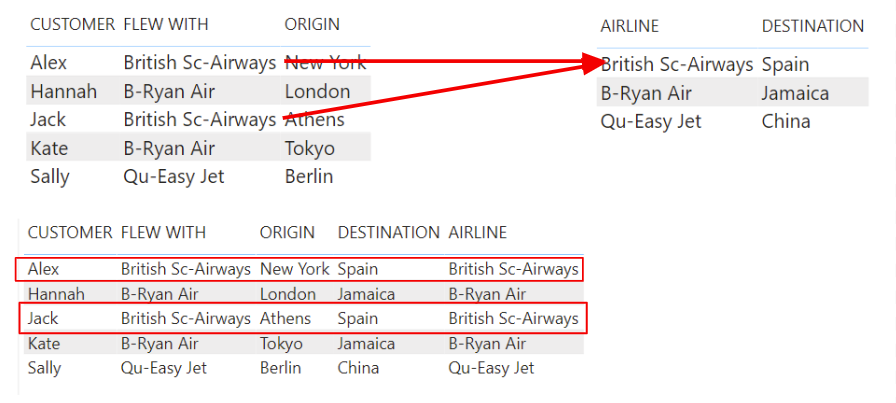
Here I want to relate tables 1 + 2 so I can find out where each customer went on holiday. The matching columns will be "Airline" and "Flew With" the values in these columns are common across both tables even though the column names are different. "British Sc-Airways" and "B-Ryan Air" appear twice in table 2 but each airline only appears once in table 1, which is why this relationship is a many-to-1.
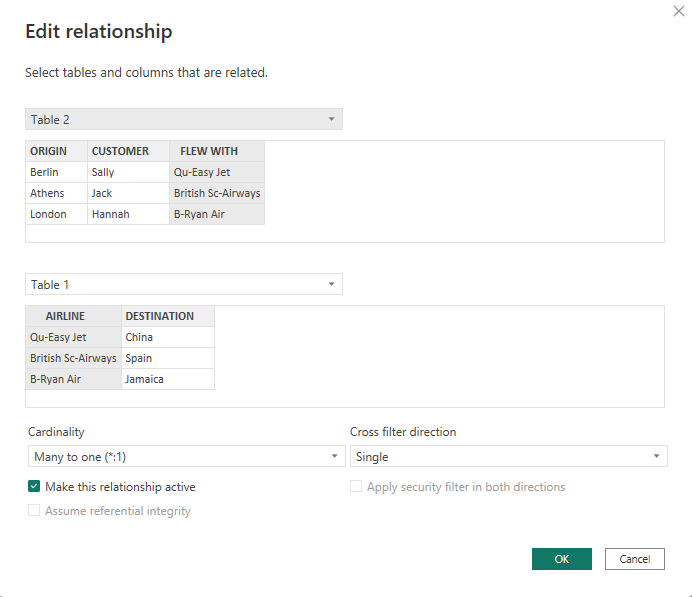
Making the relationship active just means that fields from both tables can be used to build visuals.
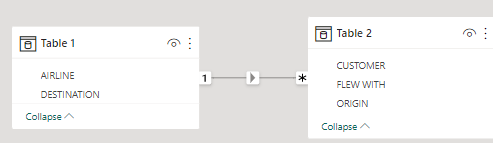
After clicking "OK" you will then see the below in your data model view. The star shows that some airlines appear more than once in table 2 (the "many" part of our relationship); the "1" shows that each airline only appears once in table 1 (the "1" part of our relationship); the arrow is showing the cross filtering direction, which was left as single. I will explain the cross filtering later on in this blog. If you hover over the connection line between the tables, the matching column will be highlighted in grey in both tables.
It can be quite useful to create tables in the report view of Power BI so you can visually see the relationships and sense check them.
Cross Filtering
In the previous example, our cross filter direction was left as single. This means that I can use table 1 to filter the data in table 2 but not the other way around as that is the direction the data is flowing, as denoted by the arrow.
If I had set the cross filter direction to double, this would be denoted by a double headed arrow and the data would flow both ways allowing me to use both tables to filter each other.
However, something to note, is that cardinality does affect the cross filter options that will be available.

1-to-1 Relationships
I now want to link table 3 to both table 1 and 2 so I can find out how much each of my customers paid for their flights. To do this I am going to create a relationship between table 2 and table 3 based on the column "Customer" as that is my common column. Since each customer only appears once in both tables, this relationship will be a 1-to-1.
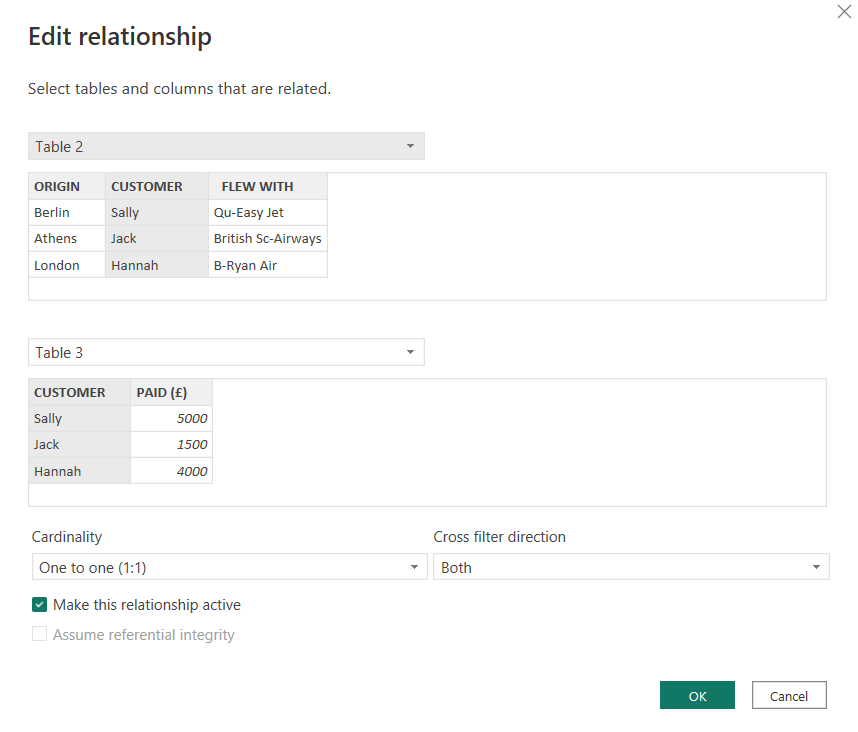
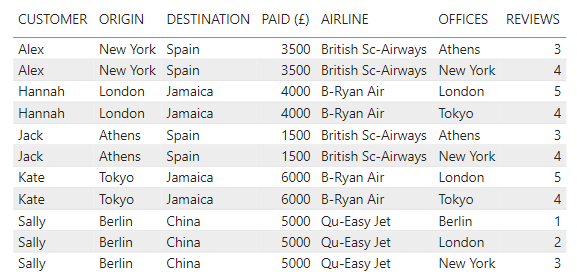
I have set the cross filter direction to "both" in the configuration meaning table 2 can filter table 3 and vice versa. Below is the resultant overall table thus far.
Many-to-Many Relationships
Many-to-Many Relationships are useful when the values in the matching columns are not unique in either table. This type of relationship removes the need to create a separate table with the unique values, in order to facilitate the relationship, as you would in a star schema. So, many-to-many relationships are typically used to create a composite model/snowflake schema like the one we are making today. This is where the tables link to each other and there is no central table with all of the matching keys.
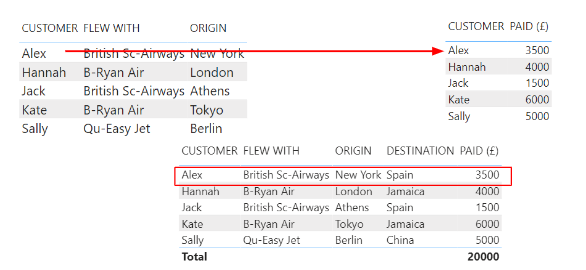
However, many-to-many relationships can explode your data, so it is important to understand them so you can still perform your analysis and make sense of your results. Power BI also warns you when you create a many-to-many relationship for this reason, as you can see in the image below.
In our case, I want to create a relationship between table 2 and table 4 so I can see the the review rating given for each airline and their HQ offices alongside the other data. The "Flew With" and "Airline" columns in table 2 and 4 respectively will be our matching fields and we can see that "British Sc-Airways" and "B-Ryan Air" appear multiple times in both tables.
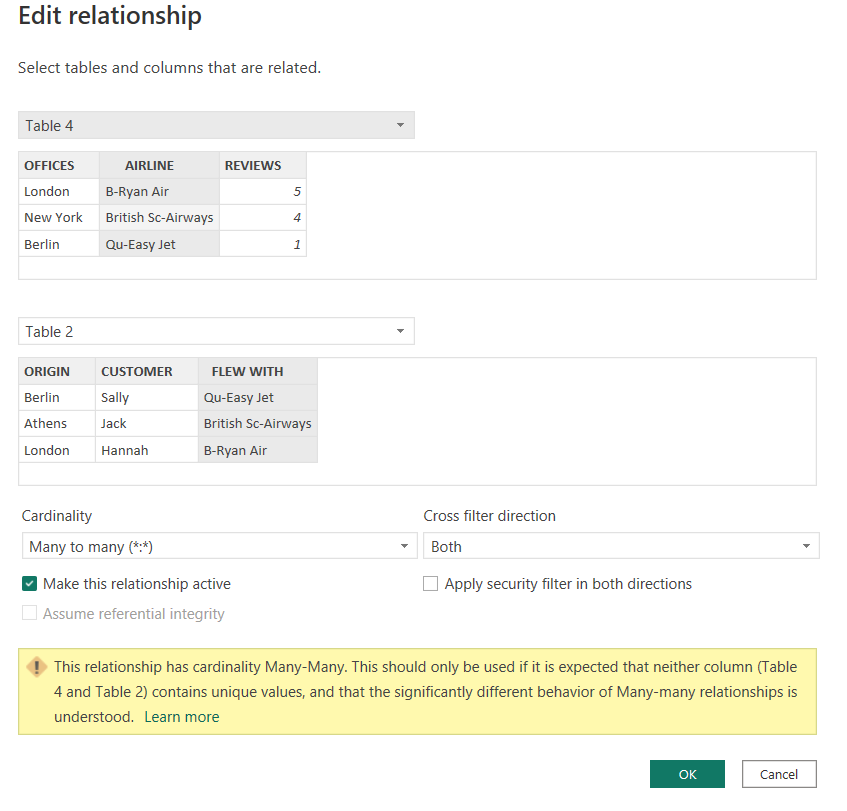
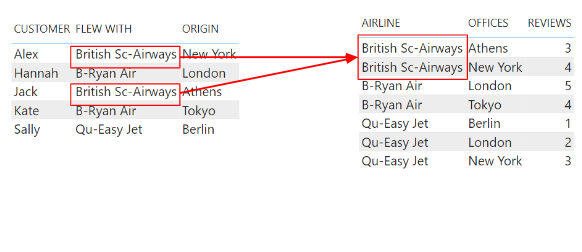
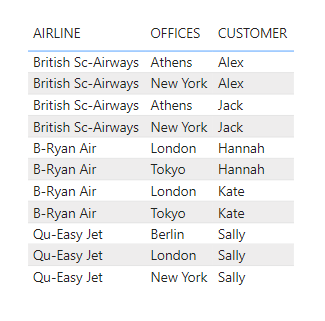
In the image above you can see how my data set can explode as I try to build out my table. I have used "Airline" and "Offices" from table 4 and "Customers" from table 2 to build this out and am getting every combination, which is why "Sally" appears 3 times because there are 3 different offices for "Qu-Easy Jet". Therefore, it is important to be aware of this, so you are still able to understand the results.
Overall
Schema
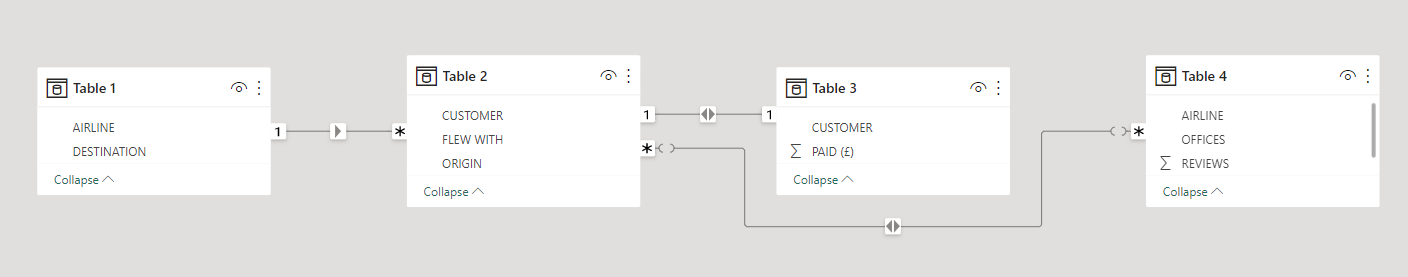
Just to highlight about the cross filtering; if you follow the arrows, you can see that table 1 can filter all the tables, but none of the tables can be used to filter table 1.
Table
I hope this blog was useful and helps you to make more sense of the data model in Power BI.