For a recent DS project I ended up with a data set that had all the information I needed in one column similar to the example below.
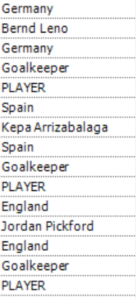
Fortunately the data is structured and repeating, every 5 lines. The aim is to get each Player on their own row with the rest of their attributes in columns.
The best way to achieve that is to use the Cross Tab tool, however a Cross Tab tool needs at least 2 columns of data to work and I need a way for Alteryx to group the lines to create column headers.
A potential way could be to use the Record ID tool to generate a number for each row and then the Formula tool to create a calculation that groups each row every 5 times but that seems unnecessarily complex.
Enter the Tile tool.

The Tile tool has 5 different functions. It acts using various methods of clustering.
Equal Records:
Assigns tiles to cover a range of values where each tile has the same total of the Sum field based on the sort order of the in-coming records.
Equal Sum:
Input records are divided into the specified amount of tiles so that each tile is assigned the same amount of records.
Smart Tile:
Creates tiles based on the Standard Deviation of the values in the specified field. The tiles assigned indicate whether the record’s value falls within the average range (=0), above the average (1) or below the average (-1).
Unique Value:
For every unique value in a specified field or fields, a unique tile is assigned. If multiple fields are specified, a tile is assigned based on that combination of values.
Manual:
The user can specify the cutoffs for the tiles by typing a value on a new line for each range.
In this example I used the Equal Records function since I want a set number of tiles and there are 5 rows within those tiles. This is calculated by dividing the number of records by 5 to get the number of tiles needed. That number of tiles for this data set is 296 which gets entered in the Number of Tiles Box.
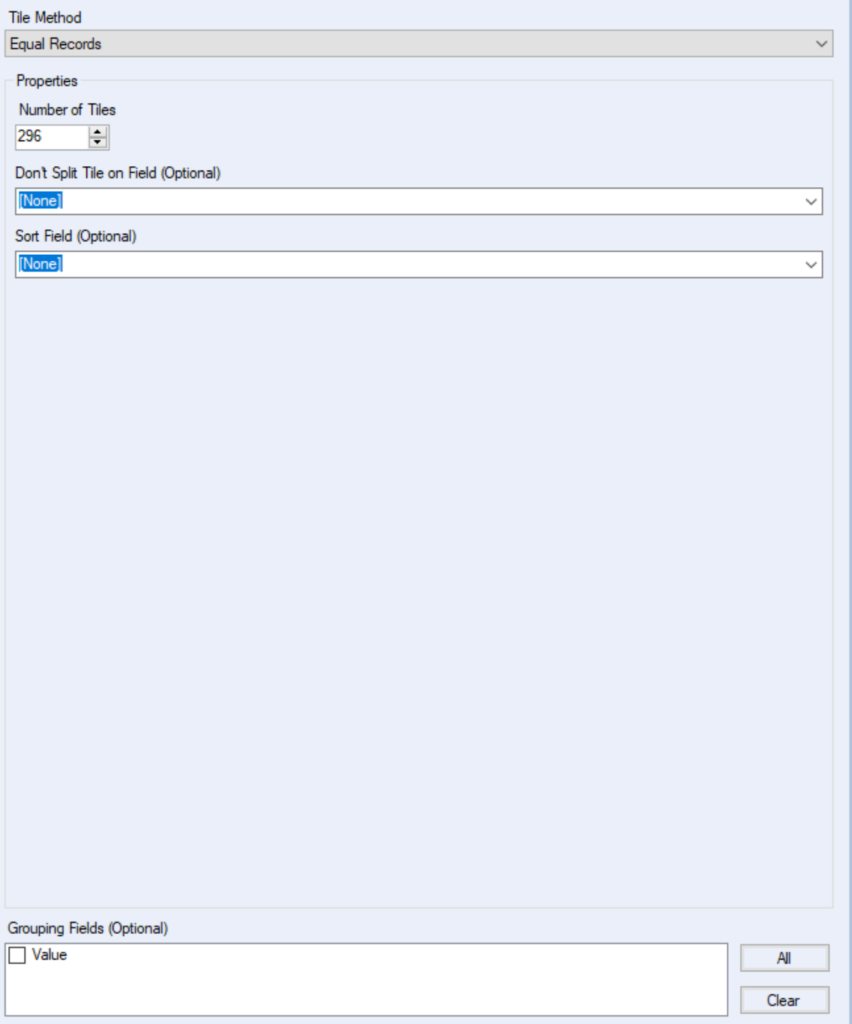
Since I’m only using this function to make clusters/groups every 5 records I don’t need to use the Sort Field or Don’t Split Tile on Field drop downs or the Grouping Fields option at the bottom.
Once the workflow is run 2 new columns get added to the data set.
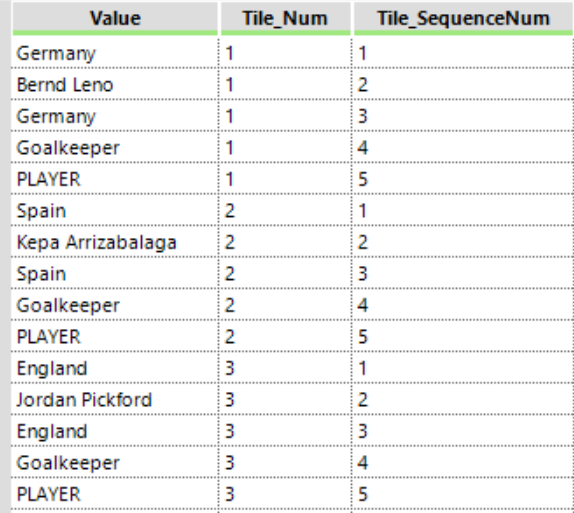
Tile_Num indicates the Tile number that the records are in (individual player and other stats), while the Tile_SequenceNum shows the sequence of the record in its particular cluster.
This works since every number in the Tile_SequenceNum is now in the same row as the same entry in the Value column ie. 2 in the Tile_SequenceNum is always equal to the player name in the Value column. As well as 4 is equal to player position.
The new columns can then be used in the Cross Tab tool. The Tile_Num column is used to group the rows, with Tile_SequenceNum used as the headers and the Value column used as Values for New Columns.
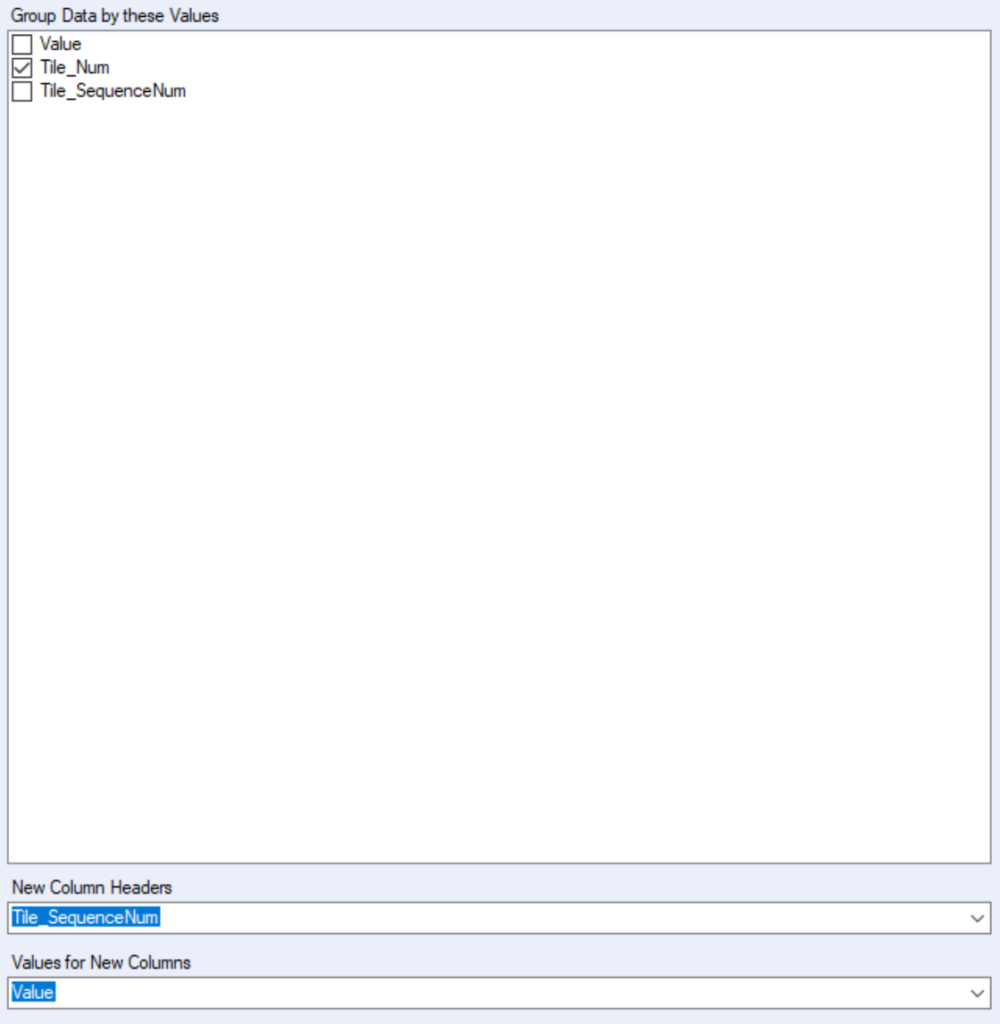
Run the Cross Tab tool and this is the end result.
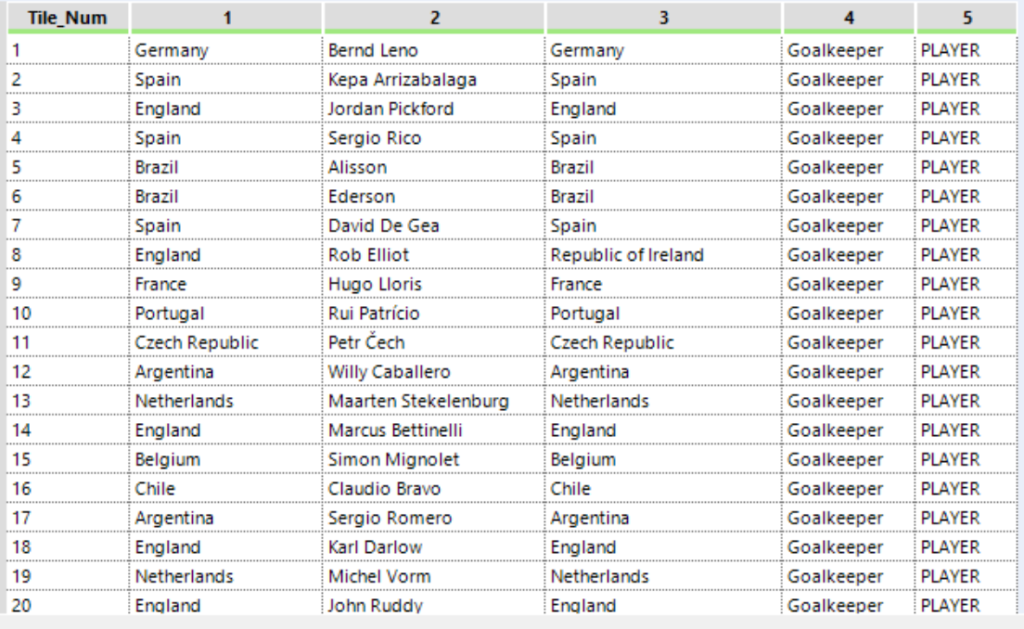
I’ve managed to get one column of records into my desired format that can be exported into Tableau for visualizing.
A Select tool can be used to rename the column headers to something more memorable
