In this post I’m going to show you a simple method for adding extra spacing between certain bars in your chart. This can be useful to make groups or categories clearer.
I’ll be using the Sample Superstore data for this example and have already thrown together a basic bar chart for Sales split by Region and Category.

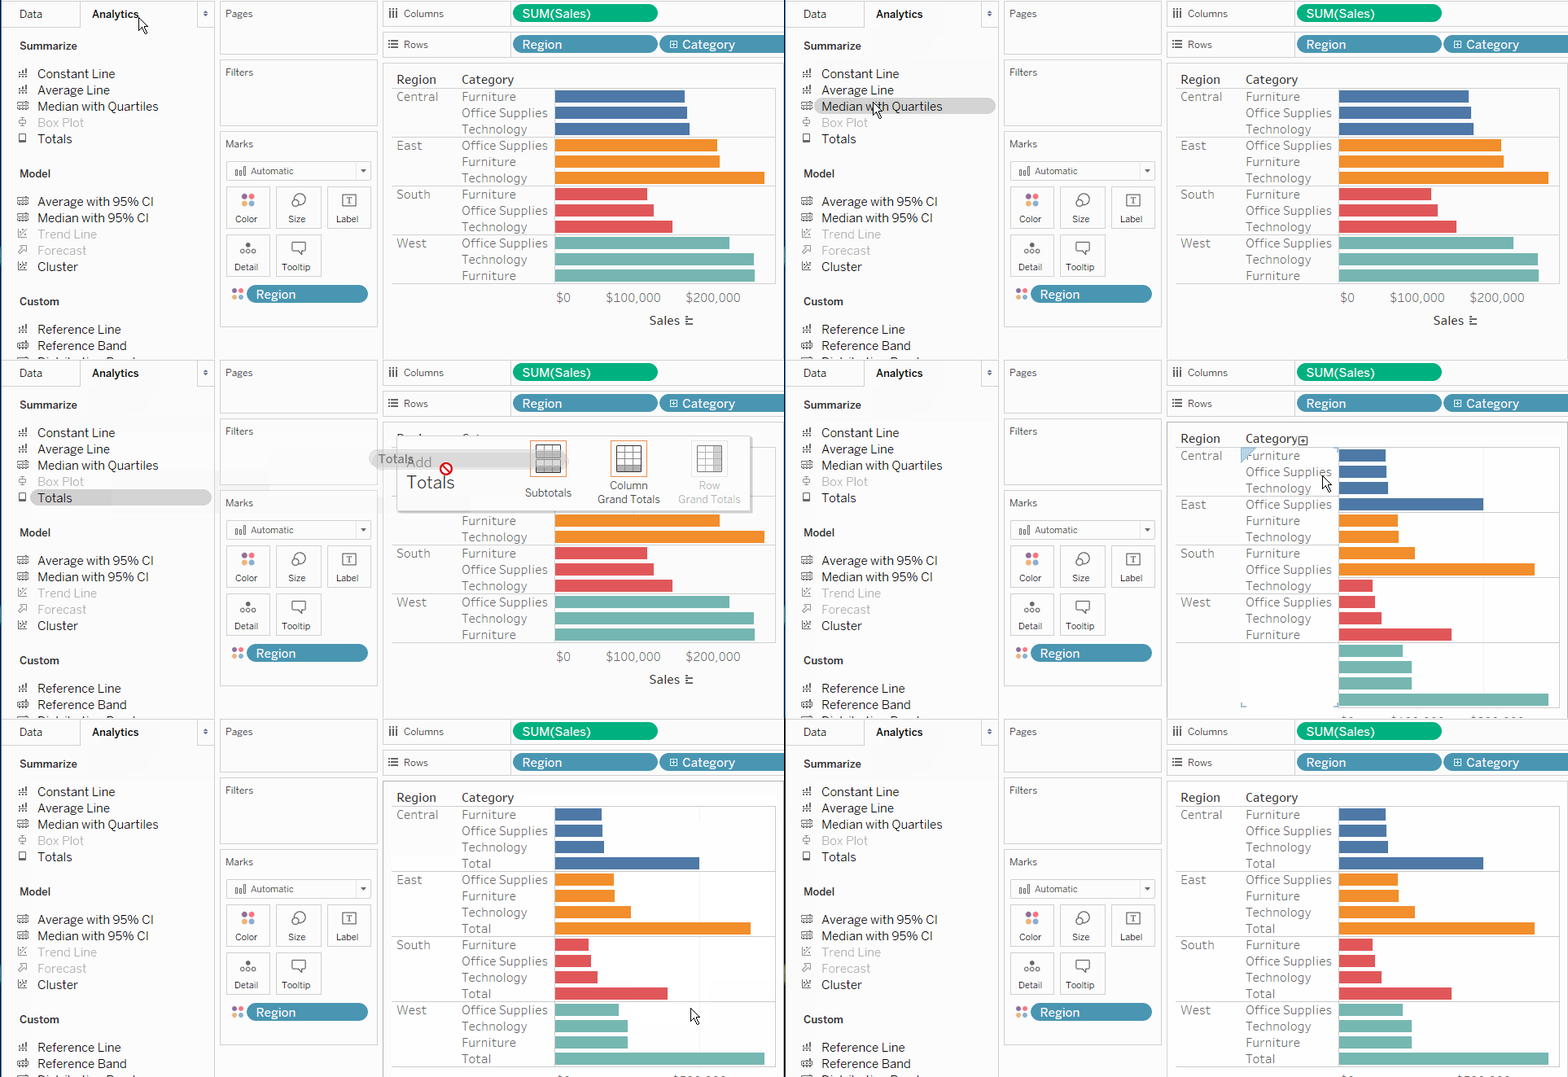
Next hit the Analytics tab and drag Totals over to your bar chart, there should be a pop-up with three options. You would drag and drop it into the Subtotals option.

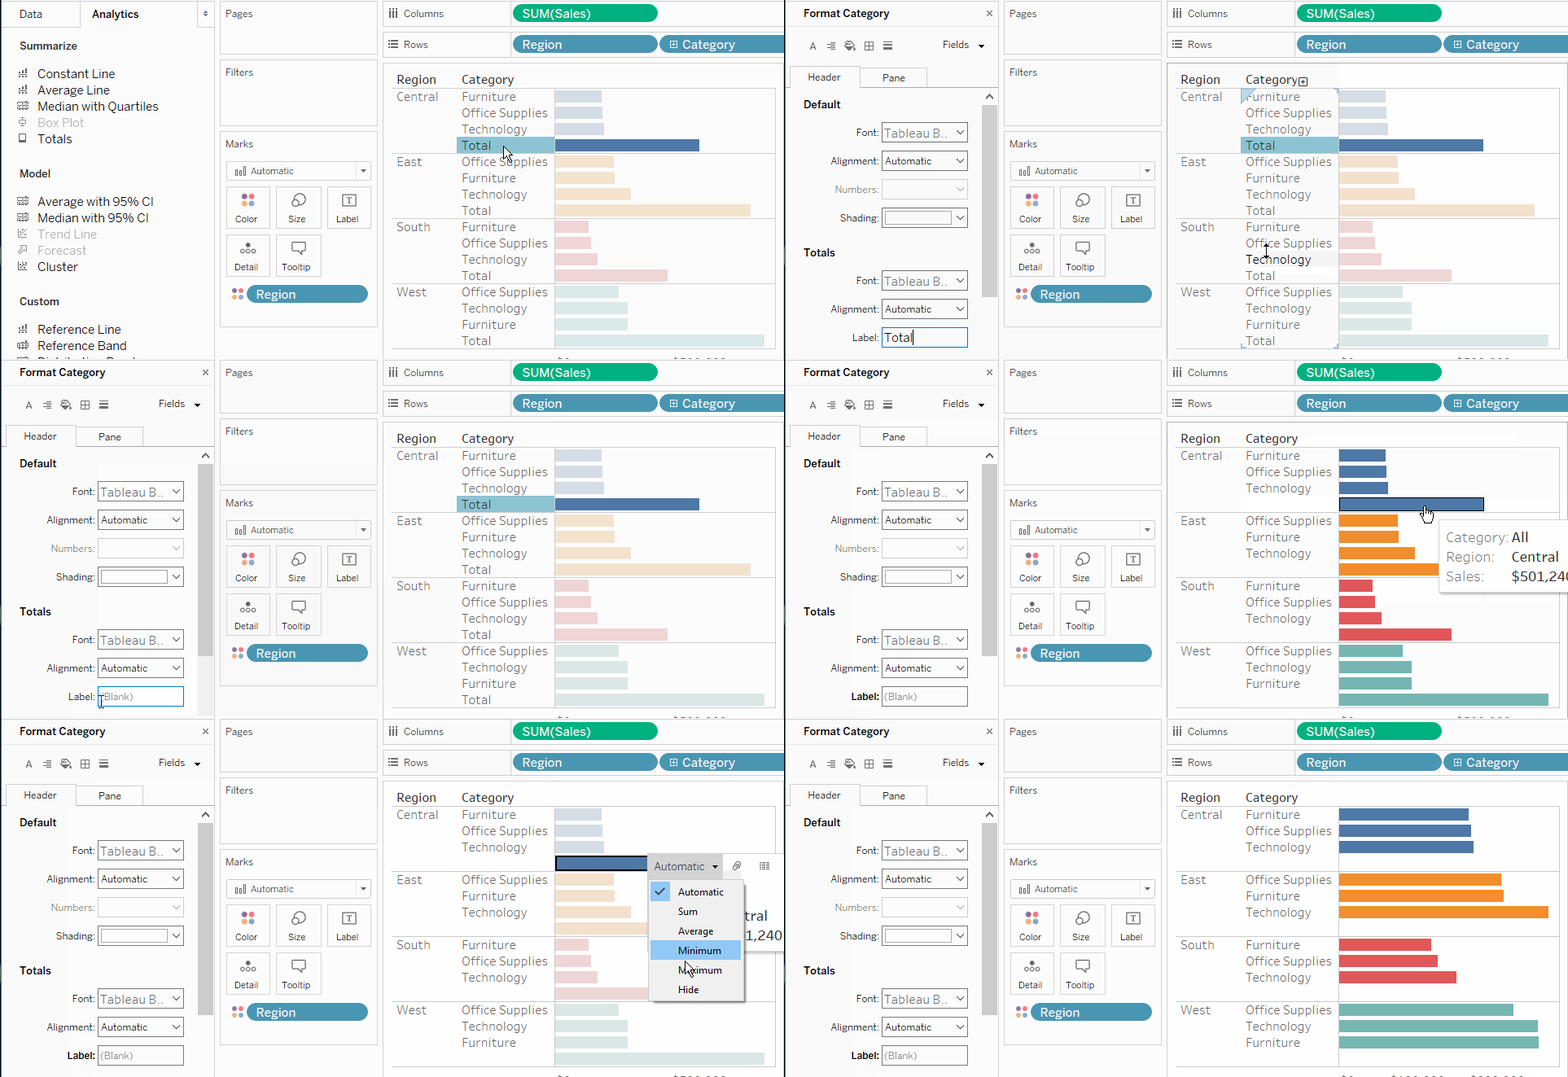
You then right-click on one of your totals label and go to Format. Make the totals label blank and click on an empty space on your bar chart. Now when you click on one of your totals bars, you can change the view from Automatic to Hide.

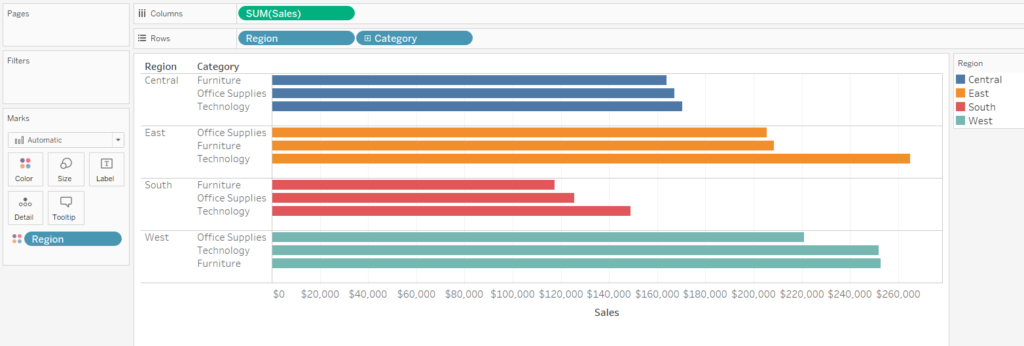
And you’re done! Here’s the finished product:

