Updated method:
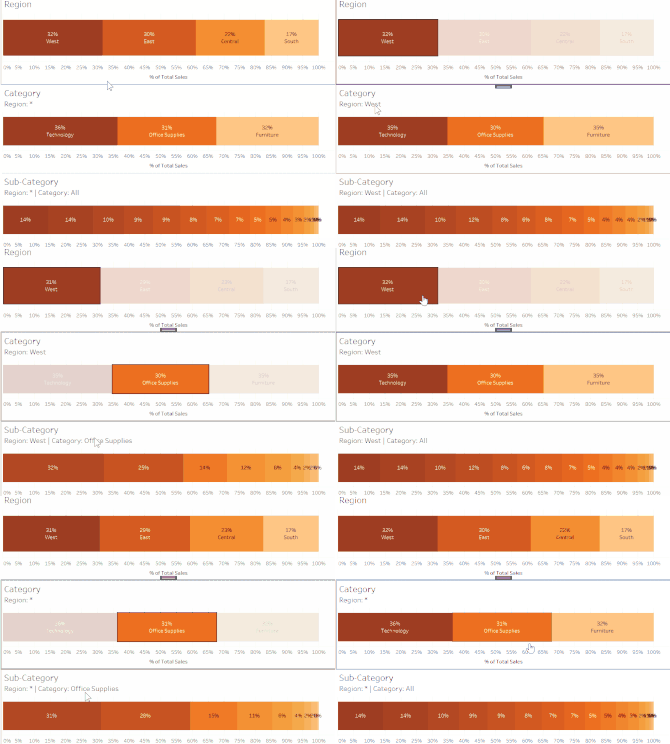
This method removes the need to use your filtering dimensions as attributes in the tooltip. After applying your dashboard filter actions, use the filter action once on the dashboard (e.g. click on a region to filter the other charts). Now when you edit the worksheet title for the other charts, Region will appear in the ‘Insert’ section even though you don’t have Region in the worksheet itself. This method brings back ‘All’ when no region is selected so you don’t see the asterisk* that you sometimes get when multiple values are selected in the filter.
Please read the the rest of the blog if the update above is unclear.
During one of our client projects, Coach Carl gave feedback that we should leave ‘breadcrumbs’ on our dashboards so that users know which filters they have already applied. This is especially useful when there’s many filters that can be applied in the dashboard and when the users are likely to print out the dashboard after applying filters. So in our next client project I decided to try and figure out how to do this myself! Here’s my simple method for breadcrumbing.
I will be using sample super store for this example. I have created some percentage of total bars worksheets measures sales split by Region, Category, and Sub-category.
In the dashboard I want the user to be able to select a Region to filter the Category and Sub-category worksheets. They should also be able to select a Category to filter the Sub-category worksheet.
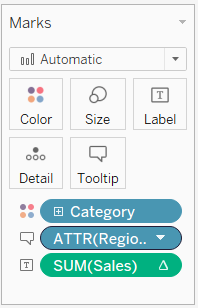
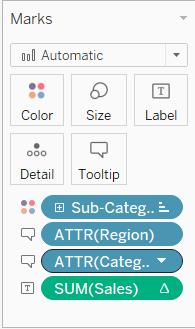
In order to add these filter selections as breadcrumbs, you need to add Region in the Category worksheet as a attribute. I simply drag this pill onto the tooltip marks card. As the Sub-Category worksheet can be filtered by both Region and Category, I added both of these pills as attributes in the Sub-Category worksheet.
Here’s what your marks shelf should look like for each worksheet:

Region worksheet 
Category 
Sub-category
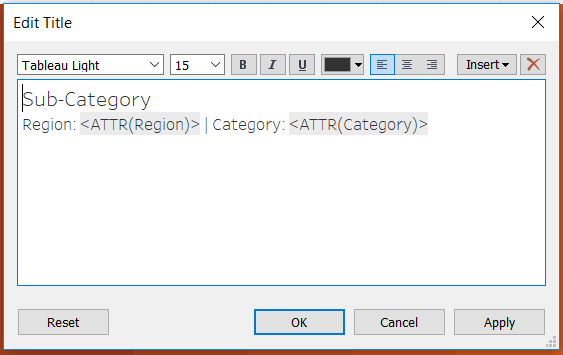
Adding the dimensions that you use in your filter as attributes allows you to include these dimension in your worksheet titles as they are now in the view. Double-click the worksheet title to edit it and use the insert button to select your attributes. You would only need to do this for the Category and Sub-Category worksheets as the Region worksheet doesn’t have any filters applied. In the ‘Insert’ section, any parameters you use in the worksheet will also appear in the list so you can use this method for parameters as well as filters.

Category worksheet title 
Sub-category worksheet title
After placing these worksheets in the dashboard and setting up the filter actions, this is what is looks like.

There you have it! Thanks for reading and I hope it’s useful.
