


For today’s challenge, we needed to get 147 years worth of data about the Major League Baseball, MLB. The biggest challenge in the data preparation was to obtain the headers for each table, which represented each year/season and to join this onto the data. This was because each dataset had no titles. In fact, they were located somewhere else.
This is what my Alteryx workflow looked like:
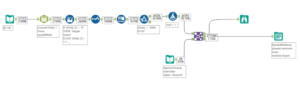
We first had to download all the files in the website and extract the files locally. This then acted as my input. I used the wildcard function which is defined as putting ‘*’ at the end of the common part of each filename.
We then manually changed the headers to the corroborating title stated on the webpage, using the “select” tool. We then did some data cleaning.
For my viz, I knew I wanted to create a curvy bump chart, which is why I filtered the dates from 2000 onwards. I then joined this dataset with an excel file that Luisa shared with me to create the path for the curves in my viz.
I then output the data into Tableau.
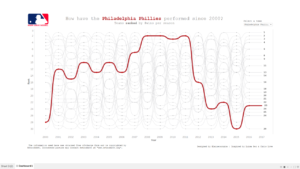
This is what my viz ended up looking.
Click on the image to see the viz on Tableau Public.
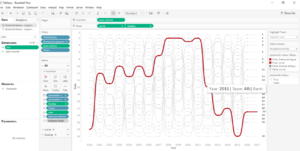
First, I had to create the necessary calculations to use in the view. Below are my calculated fields.
To calculate how many wins each team had, I used the following calculations.
Winning Team
(if ({ FIXED DATETRUNC(‘day’, [Date]), [Home Team] : SUM([Home Score]-[Visiting Score])}) > 0
then [Home Team] else [Visiting Team] end)
Wins
{ FIXED [Date], [Winning Team] : SUM(1) }
I then ranked it.
Rank
RANK(SUM([Number of Records]))
These calculations are to create the curvy lines
Rank 2 setup
IF MIN([Path])=49 THEN LOOKUP([rank],1) END
Rank 2
IFNULL(WINDOW_MIN([rank 2 setup]),([rank]))
T
((Path)-25)/4
Sigmoid
1/(1+EXP(-[t]))
Curve
([rank])+(([rank 2]-([rank]))*MIN([sigmoid]))
Dualup
FLOAT(IF MIN([Path])=1 THEN [rank] END)
Yearorder
[year]-{MIN([year])}
Path order
(49*[Yearorder])+[Path]
Yearcolumn
([path order]/49)+2000
Year
YEAR([Date])
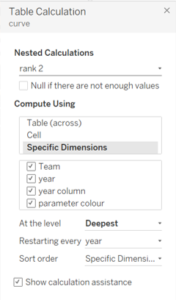
Then you need to put the following calculated fields into the rows and columns mark shelves like below:
You then need to edit the calculation for your “curve” field like below:
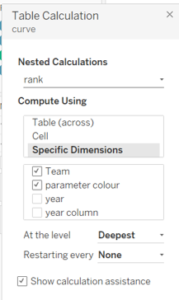
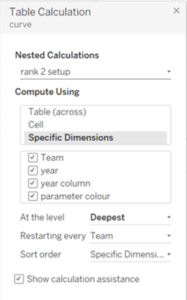
And you also need to do the same for the “dualup” field.
And there you go!