


Yesterday was the last day of dashboard week. I was relieved but also a little sad. Dashboard week was not as bad as I thought it would be. It was definitely challenging, but overall really satisfying to see all of our achievements this week.
So for Friday’s challenge, we only had 2 hours to create a dashboard. Andy had given us a dataset that was already prepared. It was a fun dataset on public toilets in Vancouver, Canada.
When I first looked at the dataset, I wanted to create a heatmap. This, however, entailed some data prep in Alteryx. In the end, I spent more time than I should in Alteryx and abandoned it altogether with only around 45 mins to spare.
This is what I ended up creating.
Click on the image to see the viz in tableau public.
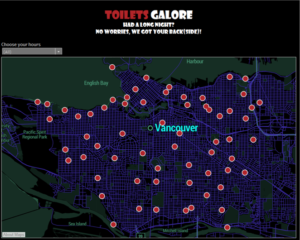
I created a map via Mapbox as longitude and latitude values for each public toiler were given in the dataset. I then decided to use collapsing views using the dashboard actions in Tableau. This meant that the user could click on a dot and it would divert you to another dashboard where further information on each public toilet was given.
I really enjoyed creating this viz and I got to try out the collapsing views!