Why is Hawaii so far from the rest of the United States? Why is Canada in between Alaska and the rest of the United States?
Trying to get Alaska and Hawaii in a dashboard with the other 48 states can lead to lots of wasted, empty space (as seen in Figure 1). In this view, Alaska looks massive, with lots of space taken up by Canada to the right. Additionally, Hawaii is side-lined and mainland US is small with the details hard to see. Many times, Alaska and Hawaii are filtered out and disregarded completely in favour of a clear view of the remaining 48 states. However, doing this means leaving out potentially valuable information.
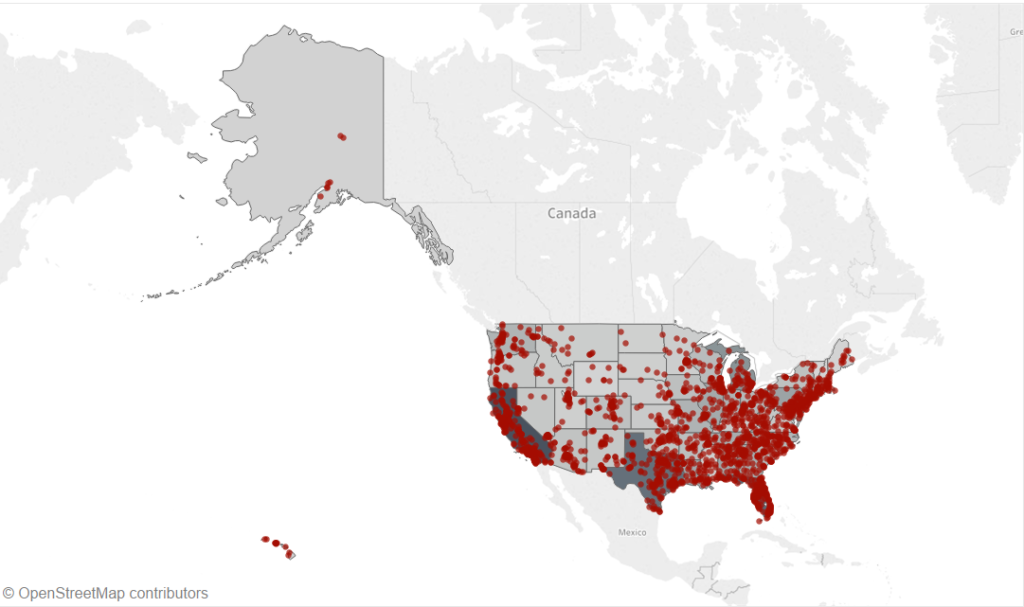
Figure 1. There is a lot of wasted space in the default view of the US maps
Is there a solution to this issue? Yes! In this blog post, I will go through a method I’ve used multiple times (Figure 2). Alaska, Hawaii and mainland USA are placed in three separate containers in a dashboard. Filters, highlighters, etc applied to one map will affect all three maps. This method eliminates much of the empty space between the lands and results in a functional and attractive way of representing all US states.
Disclaimer: I developed this method myself, however, as the Tableau community is so large and active, I am likely not the first person to lay out the US in this way.
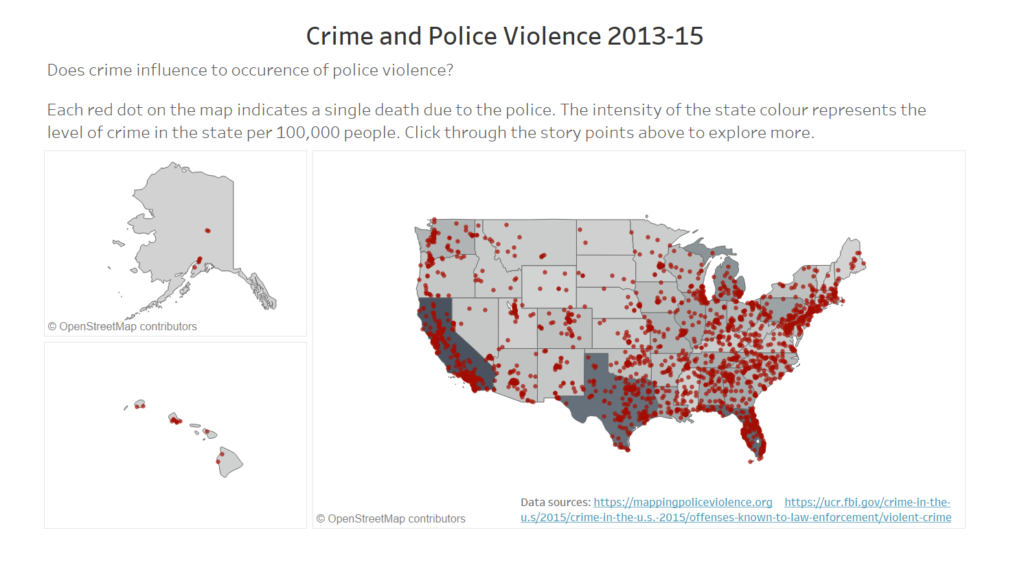
Figure 2. An improved way of representing the USA
Step One
Firstly, create a map with your data. In this case, I’ve created a dual-axis map showing crime rate by state and cases of police violence. As you can see, the layout of this map is not ideal. Our end goal is to eliminate the empty space between the areas of interest (the 50 states).
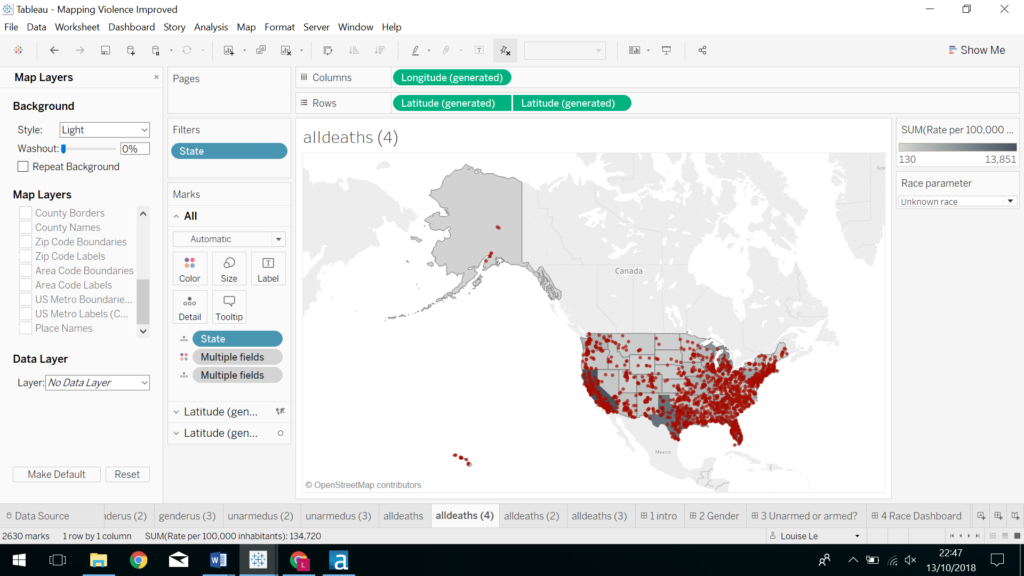
Figure 3. Create your map
Step Two
Once you are happy with your map’s tooltips, colours, labels, etc…, duplicate your sheet twice by right-clicking on the sheet and clicking “Duplicate” (Figure 4). You should now have three identical sheets. Please note that after this point, altering the formatting of one sheet will not alter the formatting of the other two sheets. To keep the formatting identical for all three sheets, it is recommended not to duplicate your sheets until you are satisfied with your initial sheet formatting.
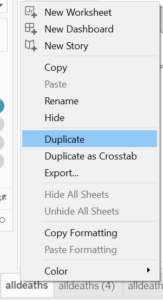
Figure 4. Duplicate your finished sheet
Step Three
Next, zoom in on Alaska on one sheet, Hawaii on another and mainland USA on the last sheet. Hint: renaming your sheet with the state name will avoid confusion as to which sheet is which later on.
Step Four
Now, create a dashboard with three containers (Figure 5). Containers 1 and 2 will contain Alaska (1) and Hawaii (2) and therefore, should be to the left of container 3, which is mainland USA.
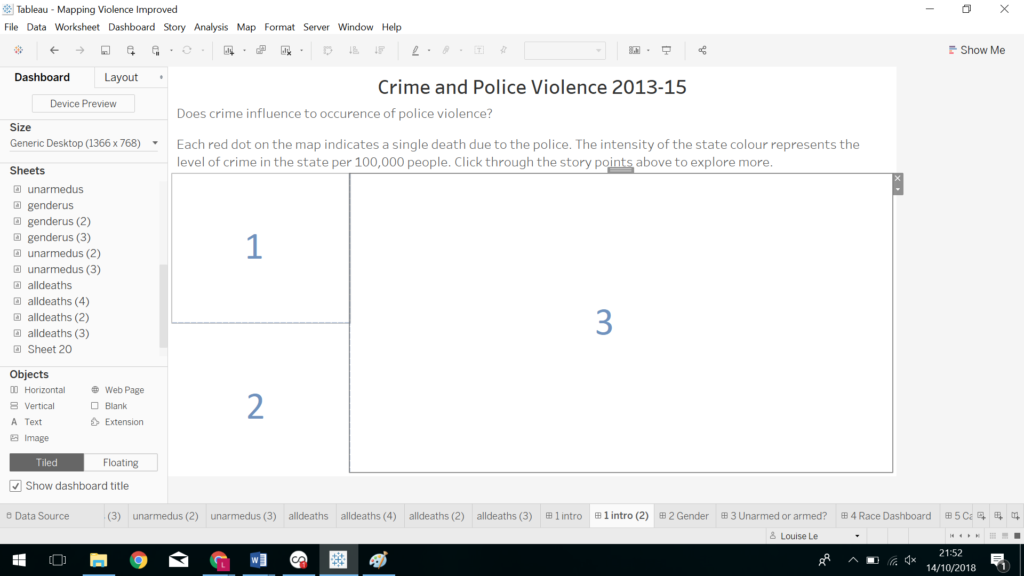
Figure 5. Create three containers for Alaska, Hawaii and mainland USA
Step Five
Finally, add your sheets to the empty containers and readjust the map zooms. Ta-da! Your final result should be similar to Figure 2 (shown again below).

Figure 2. An improved way of representing the USA
Happy vizzing!
Louise
Check out my blog feedmedata and follow me on Twitter @FeedMeData_
