Today DS11 and DS12 were treated to a talk from Simon Beaumont about data architecture, enabling customers to understand your dashboards, how to make your workbooks easy for others to pick up and more. In this post, I will go over a few things about organising your Tableau workbook Data Pane to make it easier for others to understand.
Why organise your Data Pane?
If you are working in an organisation with multiple analysts and/or people who you will hand over workbooks to, you want them to be able to understand your workbook quickly. It is better to avoid future analysts having to spend hours picking your workbook apart to understand what a calculation does or what this set is used for, etc…
Also, if you publish your work to Tableau Public, you might want to make the workbook easy to understand in case someone downloads it to learn a technique you demonstrated.
Additionally, it may help you later down the line. If you have to refer back to an old workbook and realise you don’t understand how you got to what you did, that would be a pain.
As you can see, there are numerous reasons why one should organise their Data Pane.
How could you organise your Data Pane?
Figure 1 shows a the EU Superstore Data Pane with messiness I’ve thrown in for good measure.
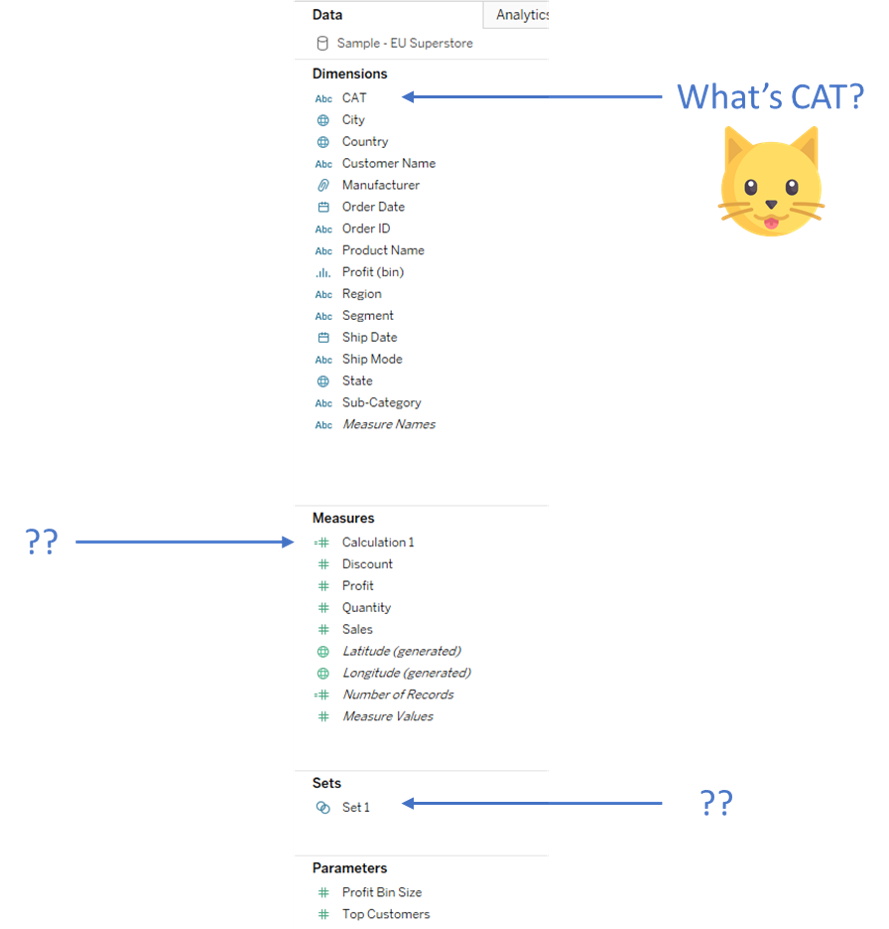
Fig 1. The Data Pane we are going to organise
1) Name your calcs, sets, parameters, etc…
As you can see, there is a calculated field unhelpfully named “Calculation 1”. This field is actually showing profit ratio. Unless you, the person who created this, remembers that Calculation 1 is profit ratio, this naming convention is not great. Let’s rename it to “Profit Ratio”. Also, “Calculation 1 (copy)” isn’t helpful especially if the calc inside is different from the original Calculation 1.
While we’re at it, let’s rename “Set 1” to what it actually shows: “Top Customers by Profit”.
2) Take the time to rename your fields
Following on from my first point, take the time to rename all the fields that could be confusing. For example, the field “CAT” in Figure 1 above is actually “Category”, this may be helpful to some but maybe not. It’s better to be safe and rename your fields something understandable. This is important if you’re bringing in a data source from a database and the field names include lots of underscores or all uppercase or abbreviations that are unknown to a normal reader.
3) Annotate your calculated fields
This helps others immensely. If the calculation is incredibly long and the calculation name is not enough for the reader to understand the calculation then annotations are absolutely necessary. Figure 2 shows an example of a annotation/comment.
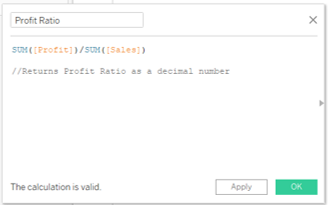
Fig 2. Annotate your calculations with a double forward slash
4) Change the default number format on your measures
If a field contains all percentages but currently displays as decimal numbers, as is the case for Profit Ratio in point 3 above, you should change the default number format to a percentage. Figure 3 shows how you can do this. It is important to do this as it makes more sense for others and it will appear in your view in the correct format. For example, your percentages will appear as 68.2% and not 0.682
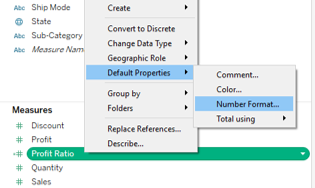
Fig 3. Right-click > Default Properties > Number Format…
5) Add comments to your fields
Don’t worry! This is not the same as point 3 above. This is my favourite tip from Simon today. Adding a comment on a field adds a little tooltip-like pop up when you hover over a field. Figure 4 shows a comment I’ve put on the field “Segment”. When I first opened Superstore, it wasn’t immediately obvious to me what Segment meant. Only by bringing Segment into the view did I realise it showed the types of customers. Now I could change the field name to type of customer, but in case Segment is a commonly used term, I’ll just create a comment instead. Figure 5 shows how you can make a comment.
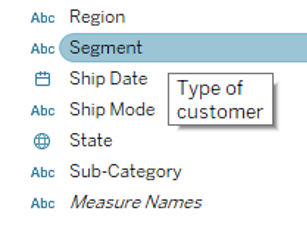
Fig 4. Add comments to make field names clearer
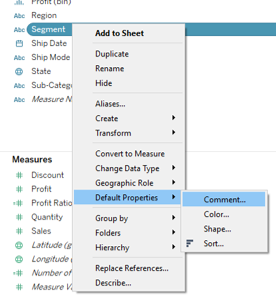
Fig 5. How to make a comment on a field
6) Use folders to organise similar fields
This is great for when you have dozens of dimensions or measures and many of them relate to one another. You can quickly find all your ID fields or all you calculations, etc.. In our example above, we could create folders for dates, ID fields and locations for instance. To create a folder, right-click on some whitespace in your Data Pane and click Create Folder as shown in Figure 6. Next, drag in the field you want, as shown in Figure 7.
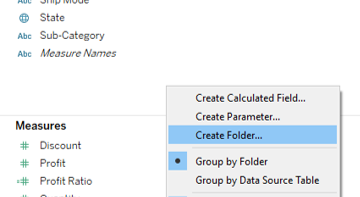
Fig 6. How to create a folder
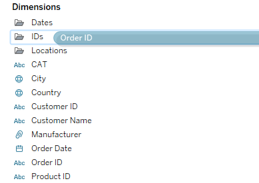
Fig 7. Adding fields to folders
Ta-da! An organised Data Pane…
Ain’t it pretty?

That’s all, folks!
Louise
Check me out my blog feedmedata and follow me on @FeedMeData_
