


Tableau’s Analytics pane allows you to slap an average line onto your view. Drag, drop, done?
Not quite. In this blog, I will show you an example of when the average line Tableau creates for you may not be doing what you think it does.
Let’s start
So Figure 1 below shows a vertical bar chart with the height of each bar indicating the number of customers that fall into each number of orders bucket. For example, 134 customers have ordered 5 times; 1 customer has ordered 17 times.

Fig 1. A vertical bar chart showing how many orders customers have
Average Method 1
Now, what if you want to see how many orders your customers have on average? Let’s drag an average line from the Analytics pane onto the view as shown in Figure 2:
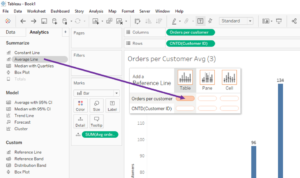
Fig 2. Add an average line into your view
What you get, is an average line showing 7.71 (see Figure 3).
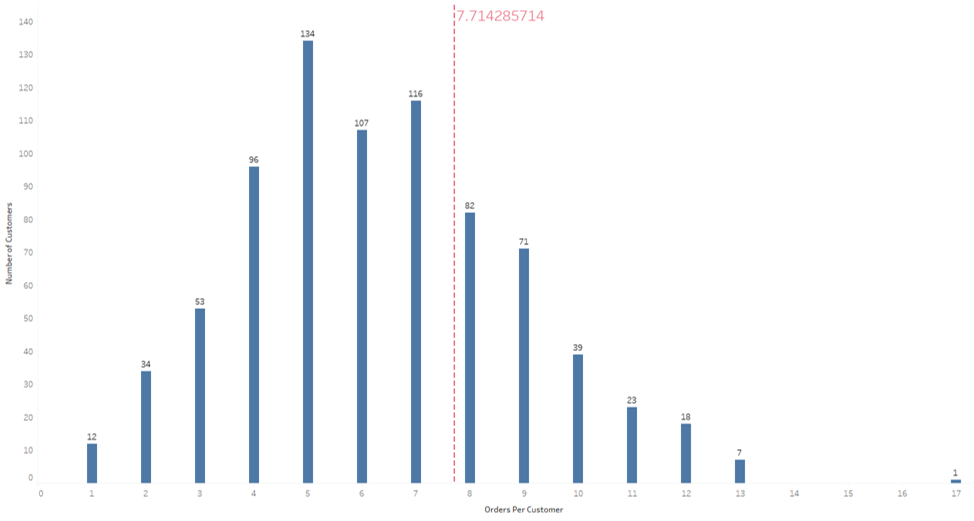
Fig 3. The average line value is 7.714…
Now is this correct? Yes and no. Figure 4 shows how Tableau is calculating your average. Because we created our average line on Orders Per Customer (the x-axis), Tableau is adding up all the values on the x-axis and dividing it by the count of values. What you may have wanted (and what is probably better) is a weighted average, one that takes into account the number of customers in each bucket instead of treating each bucket as equal value.
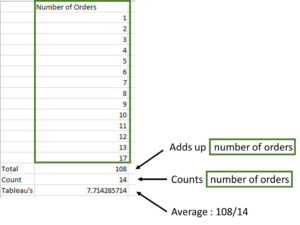
Fig 4. How Tableau is calculating the average
Average Method 2
Orders Per Customer, on the Columns shelf, is an LOD as shown in Figure 5. It counts the number of orders for each customer.
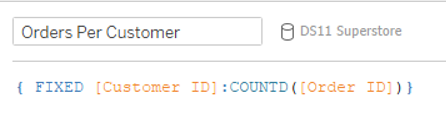
Fig 5. The LOD expression used to calculate Orders Per Customer
Now let’s write another calculation. In this one, we would like to calculate the weighted average Orders Per Customer, i.e. the total number of orders divided by the total number of customers.
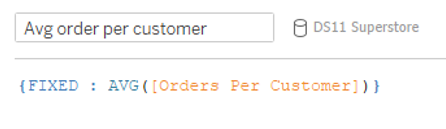
Fig 6. An LOD expression used to calculate a weighted average
The result of this average calculation is 6.317, as shown in Figure 7.
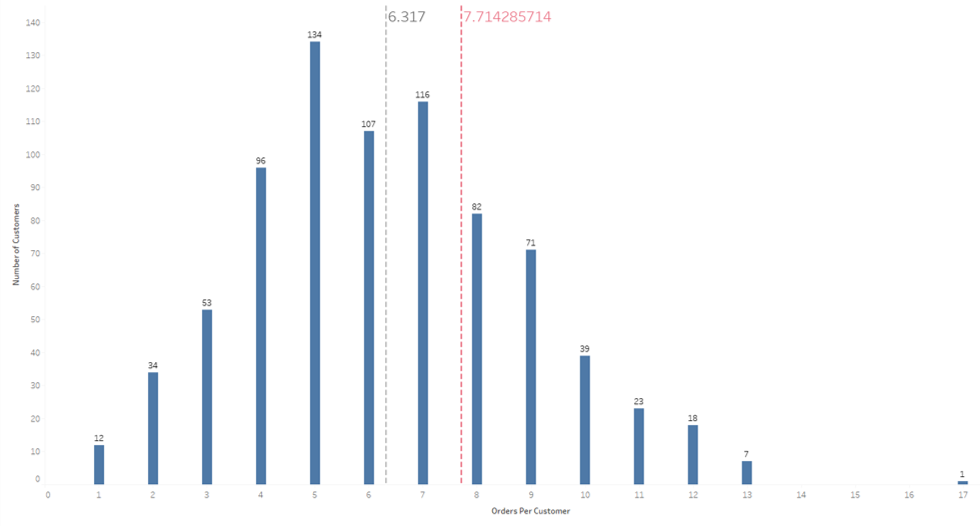
Fig 7. The weighted average is 6.317
So why is this different? Figure 7 shows how this LOD is calculating this average:
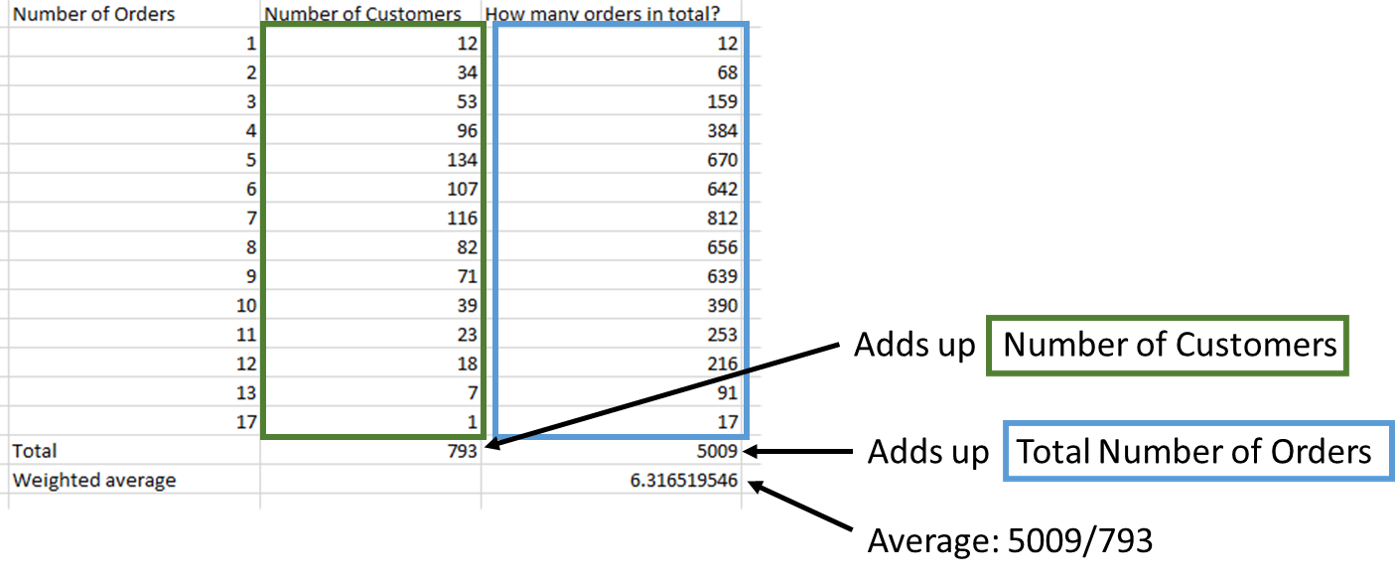
Fig 8. How the LOD expression in Figure 6 is calculating the average
Which one is right?
Both are technically correct but Method 2 is probably less confusing and more what you would expect from an average. To prove why Method 2 is better, take a look at what happens when I select two Orders Per Customer values, 5 and 6:
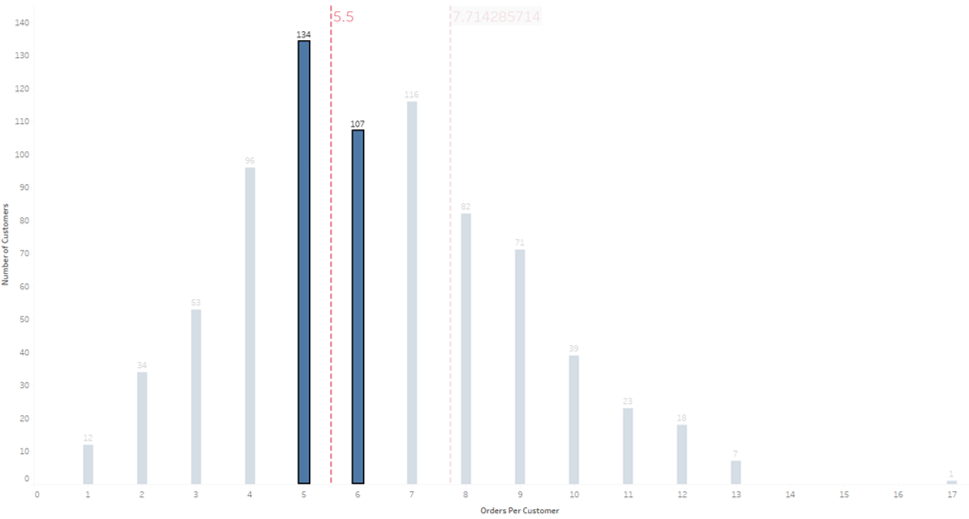
Fig 9. What happens when you select two values
The average is being recalculated as 5.5 for these two values, i.e. the mid-point between 5 and 6. 5.5 would only be the correct answer if there were the same number of customers for each bucket. But since 134 customers have ordered 5 times and 107 have ordered 6 times, the weighted average is 5.44.
Be careful next time you add an average line. Make sure it’s doing what you want it to do!
That’s all, folks!
Louise
Check me out my blog feedmedata and follow me on @FeedMeData_